What are Choropleth Maps used for?
A choropleth map represents numerical values over geographical areas by using color, shading, and other patterns. To distinguish between high and low values, these representations use a progression of color (or shading) on a spectrum.
Viewers can observe how a variable change from one region to the next using choropleth maps. The fact that the colors represent a range of values makes it difficult to access the precise numerical values, which could be a drawback to this style of display. However, you may add interactivity to your map using natural language question to NLSQL bot so that you can get the precise values.
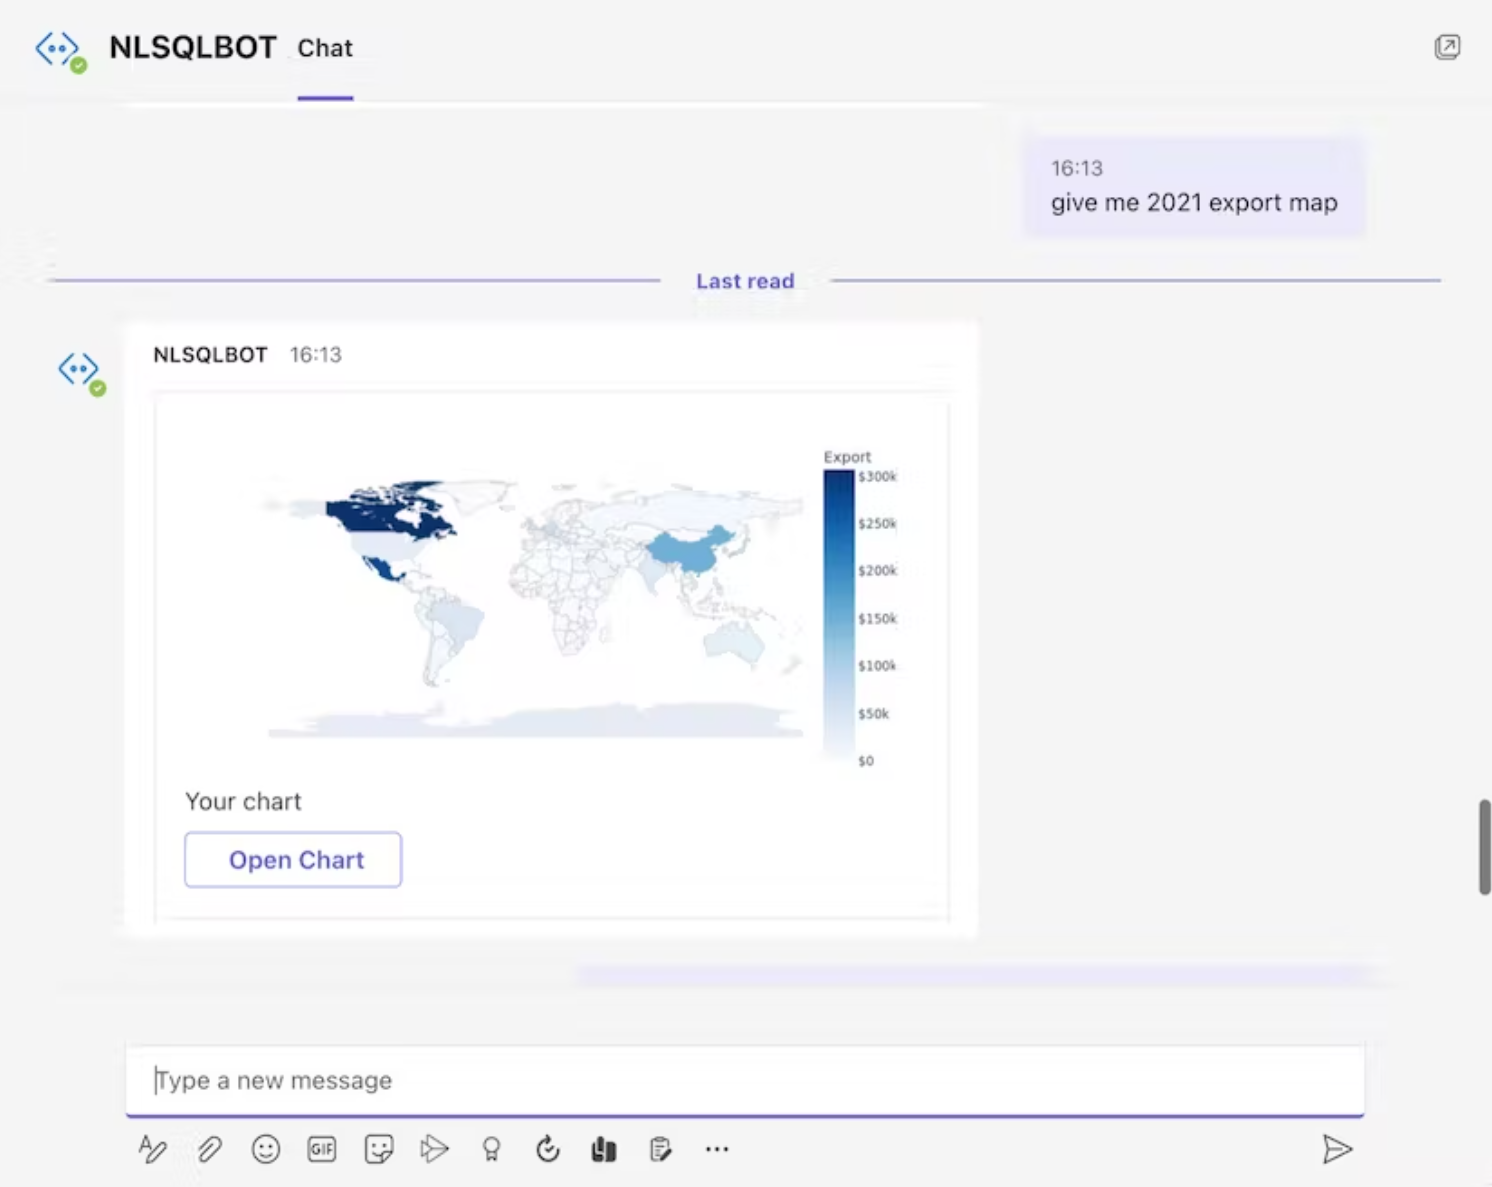
With NLSQL you can create the Choropleth Maps by asking a question in plain English (you can check how we did it on the pictures or start our 30 days free trial to try it on your data by yourself with a link below)