Latest News
8 Tips for Identifying Business Market Growth Potential
We'll go through eight strategies to spot market growth prospects in this post. To accomplish so, you must first grasp the business orientation of your organization and then conduct market research. Consumer requirements and other considerations, such as brand value propositions, must all be considered while evaluating the business strategy.
1. Segmentation of customers
You must first establish consumer categories with similar features in order to understand your demand. Age, gender, location of residence, educational level, occupation, and income level are examples of "hard" factors, whereas lifestyle, attitude, values, and purchase impulses are examples of "soft" variables.
Hard factors might aid in the estimation of a company's prospective consumer base. Price, prestige, convenience, durability, and design are examples of soft factors that might assist in identifying purchase reasons.
2. Evaluation of the purchase scenario
Sales analysis may assist you in better understanding how customers buy and positioning your goods and …

How does Azure Marketplace work?
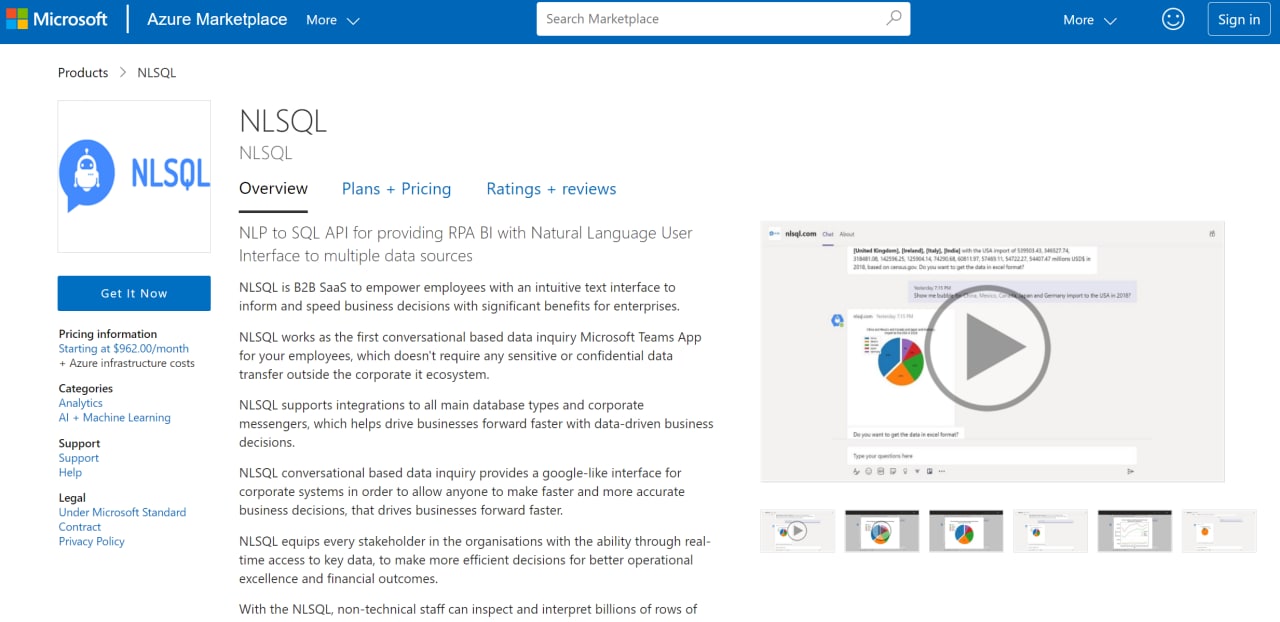
Jake Zborowski, General Manager, Microsoft Azure Platform at Microsoft Corp. said, “We’re pleased to welcome NLSQL to the Microsoft Azure Marketplace, which gives our partners great exposure to cloud customers around the globe. Azure Marketplace offers world-class quality experiences from global trusted partners with solutions tested to work seamlessly with Azure.”
The Azure Marketplace is an online market for buying and selling cloud solutions certified to run on Azure. The Azure Marketplace helps connect companies seeking innovative, cloud-based solutions with partners who have developed solutions that are ready to use.
NLSQL Ltd., today announced the availability of NLSQL in the Microsoft Azure Marketplace, an online store providing applications and services for use on Azure. NLSQL Ltd. customers can now take advantage of the productive and trusted Azure cloud platform, with streamlined deployment and management.
NLSQL, a UK-based software development company, has been driving digital transformation and innovation in large-scale enterprises …

Using Natural Language Text to Query Database with SQL
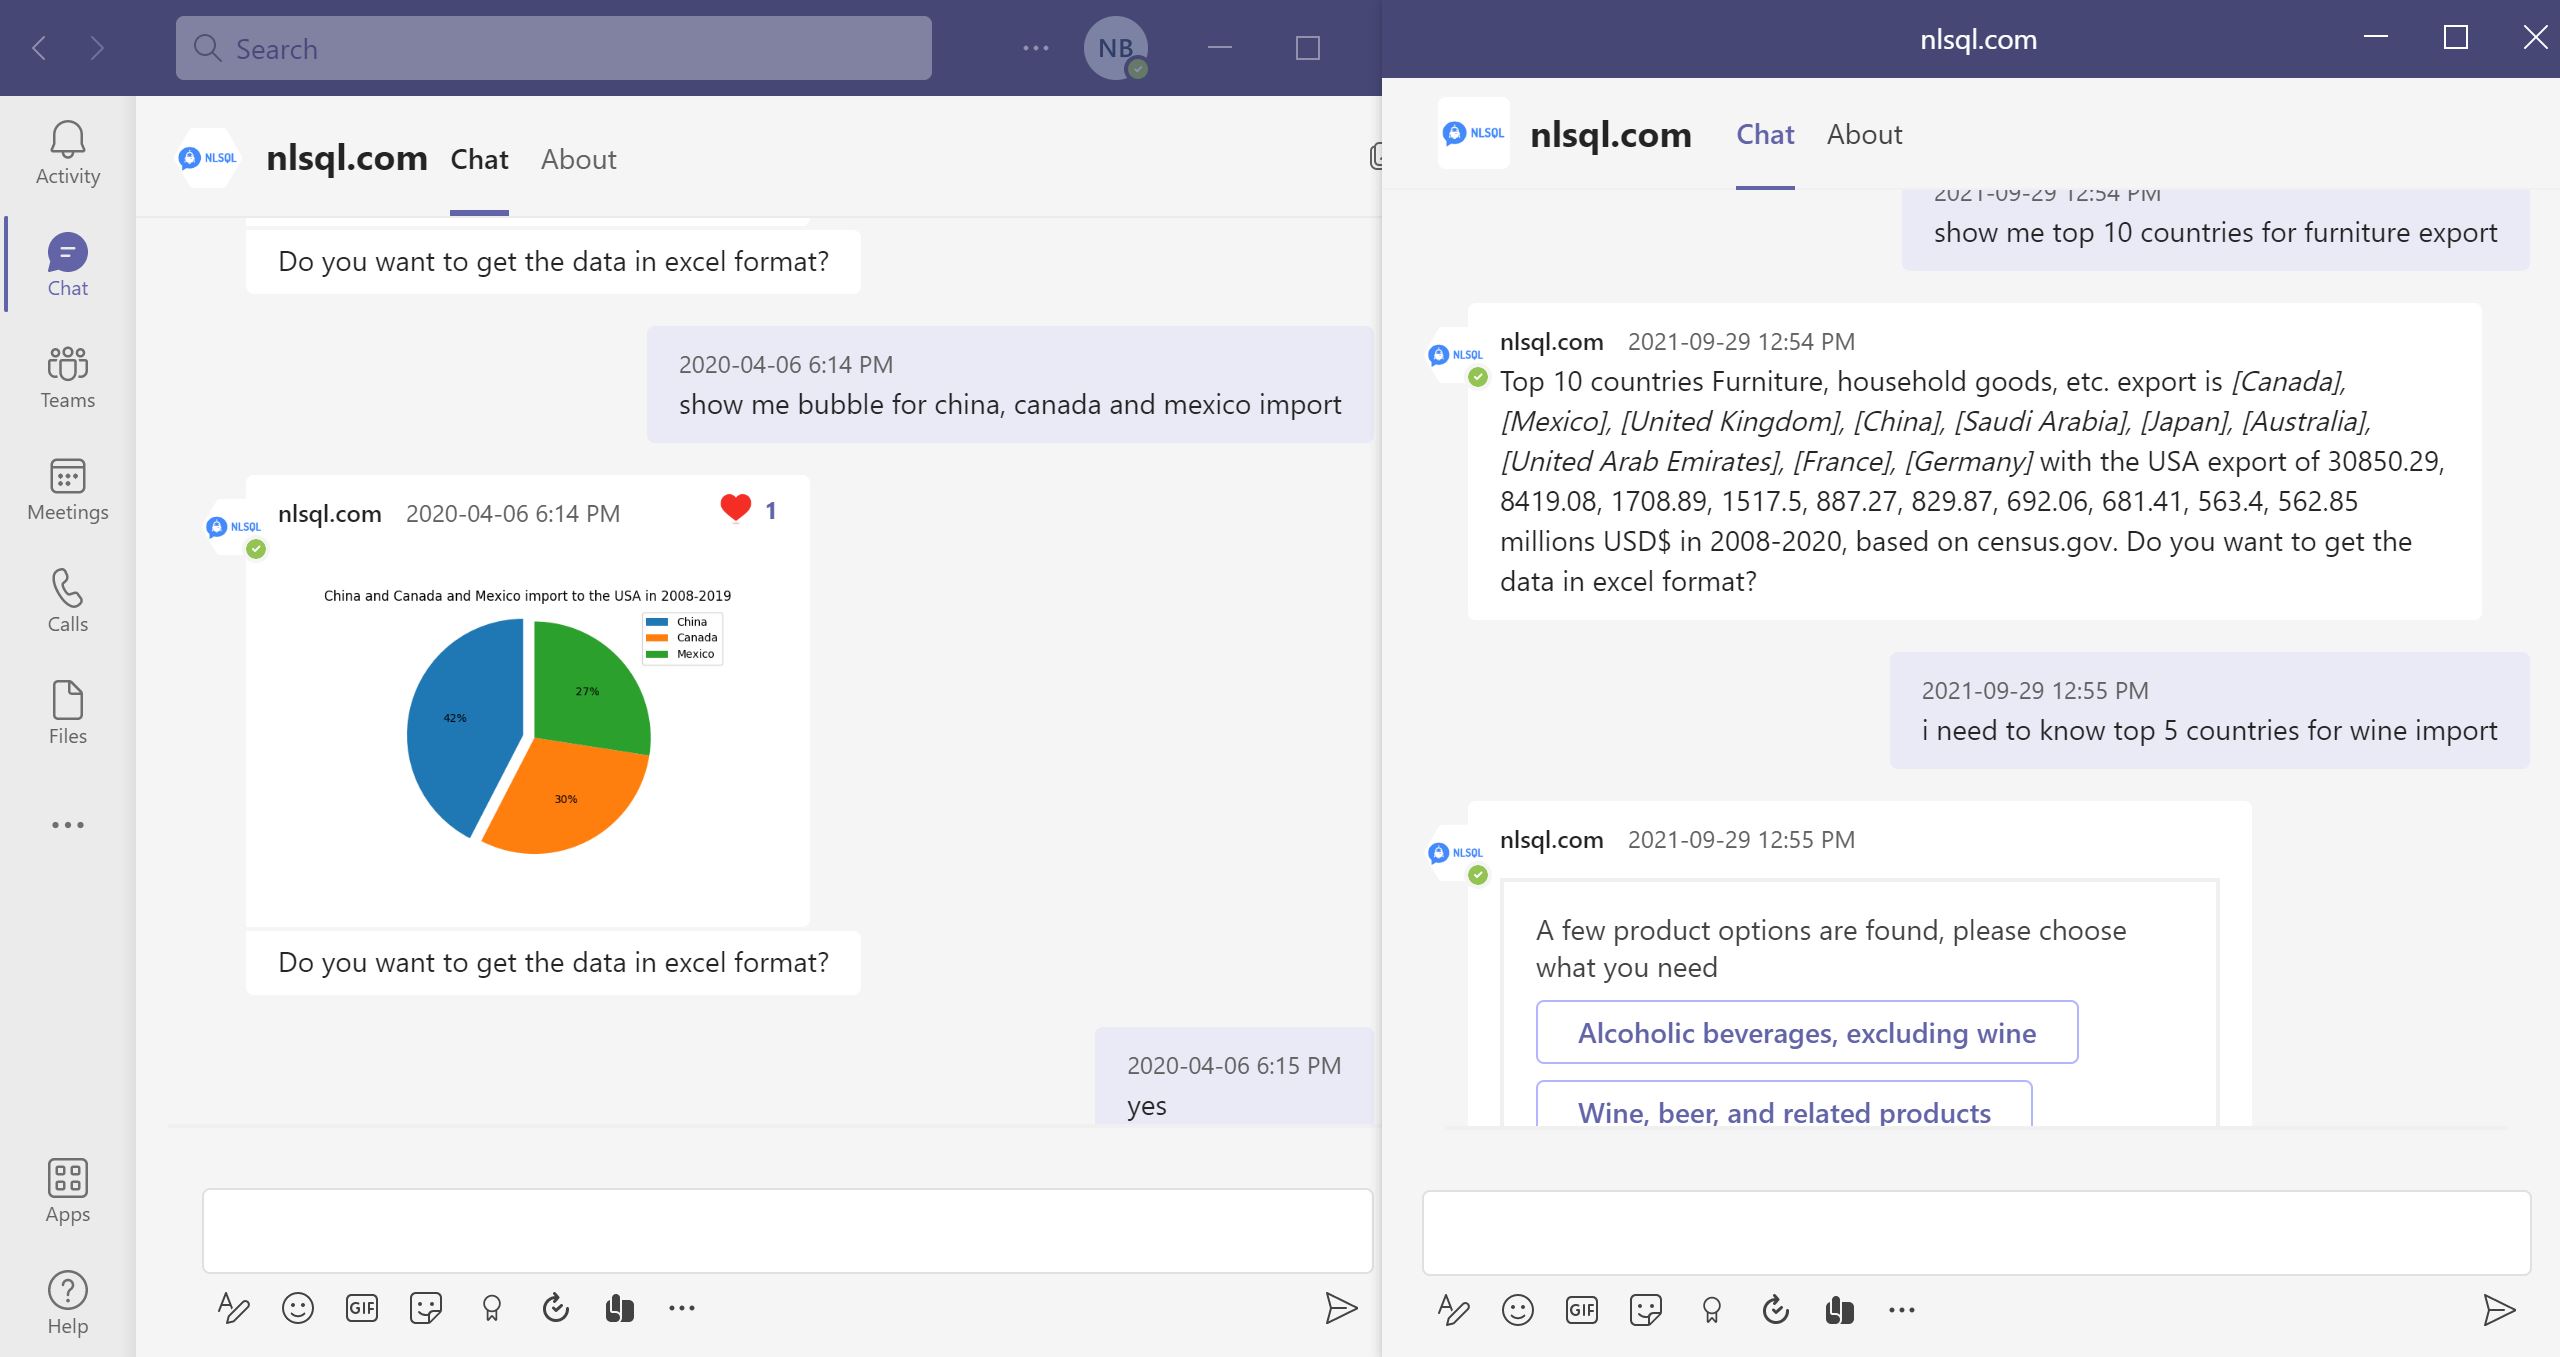
By transforming natural free-flowing query language into a structured query format, Natural Language Processing (NLP) allows question answering on a dataset. This is still one of the most challenging tasks in NLP, and it has gotten a lot of attention recently thanks to the availability of efficient language models.
The ability to convert natural language inquiries into Structured Query Language (SQL) has a wide spectrum of uses:
• Making data-driven insights available to those who don't know how to code
• lowering the time it takes to gain knowledge in a certain topic
• Increasing the value of the data that has been collected
As the amount of digital data has grown, a big amount of it has remained unanalyzed due to a lack of:
• infrastructure to keep it running
• processing techniques that are efficient
• There aren't enough individuals with the technical know-how to work with it. …

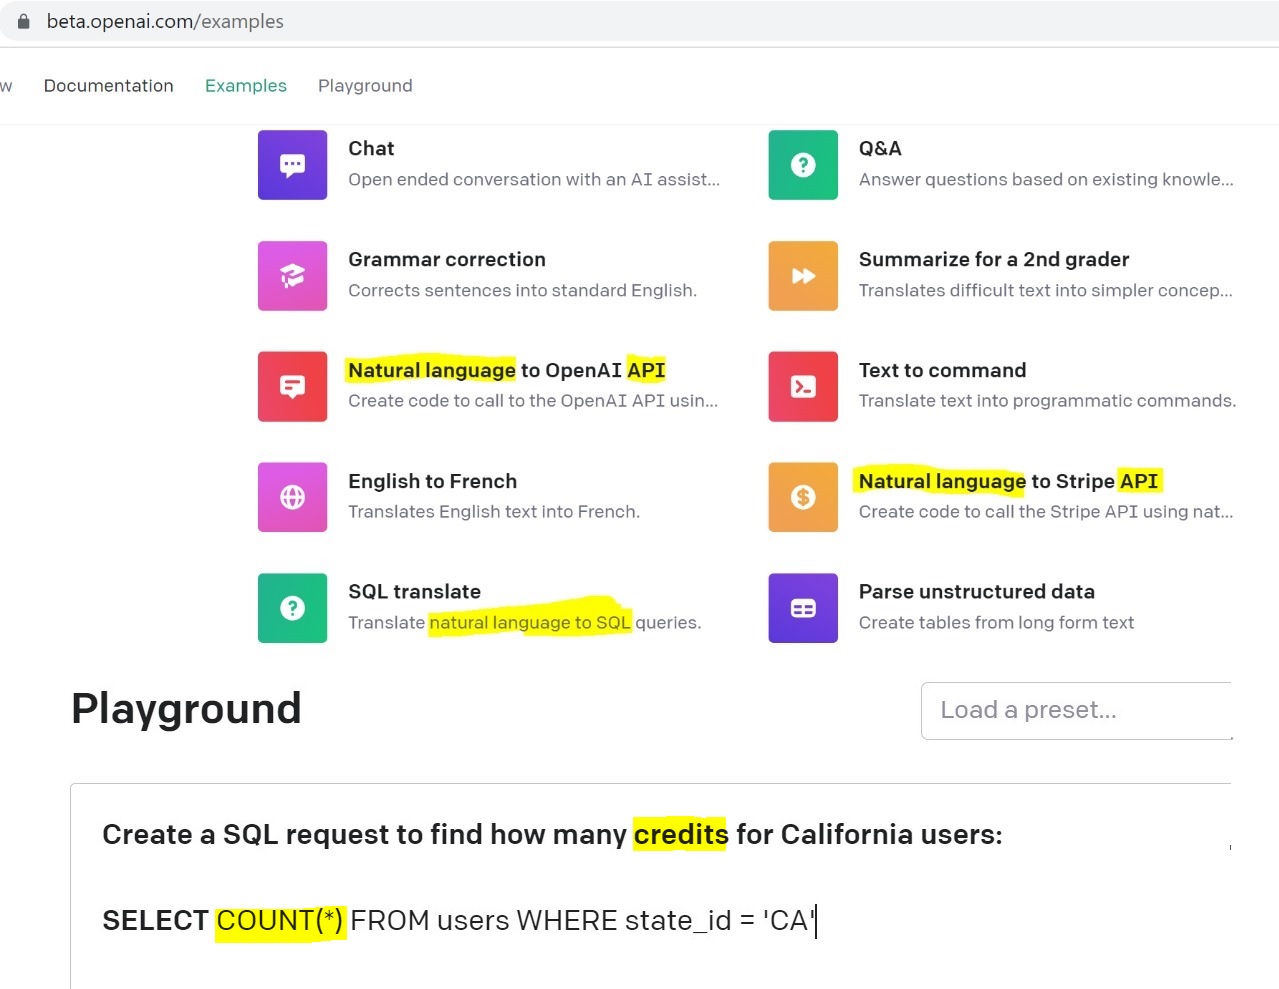
OpenAI Natural Language to SQL Generator Review and Comparison
OpenAI released GPT-3.5 to open-source community access for everyone this year.
Unlike most AI systems which are designed to focus on one specific use-case, the OpenAI API has multiple services that are able to perform different tasks.
There are really promising services as Parse unstructured data and Extract contact information web services. Available summarisation and text generation service is one of the best for OpenAI within the industry, but we will focus this review on AI system by GPT-3.5 that translates natural language to SQL.
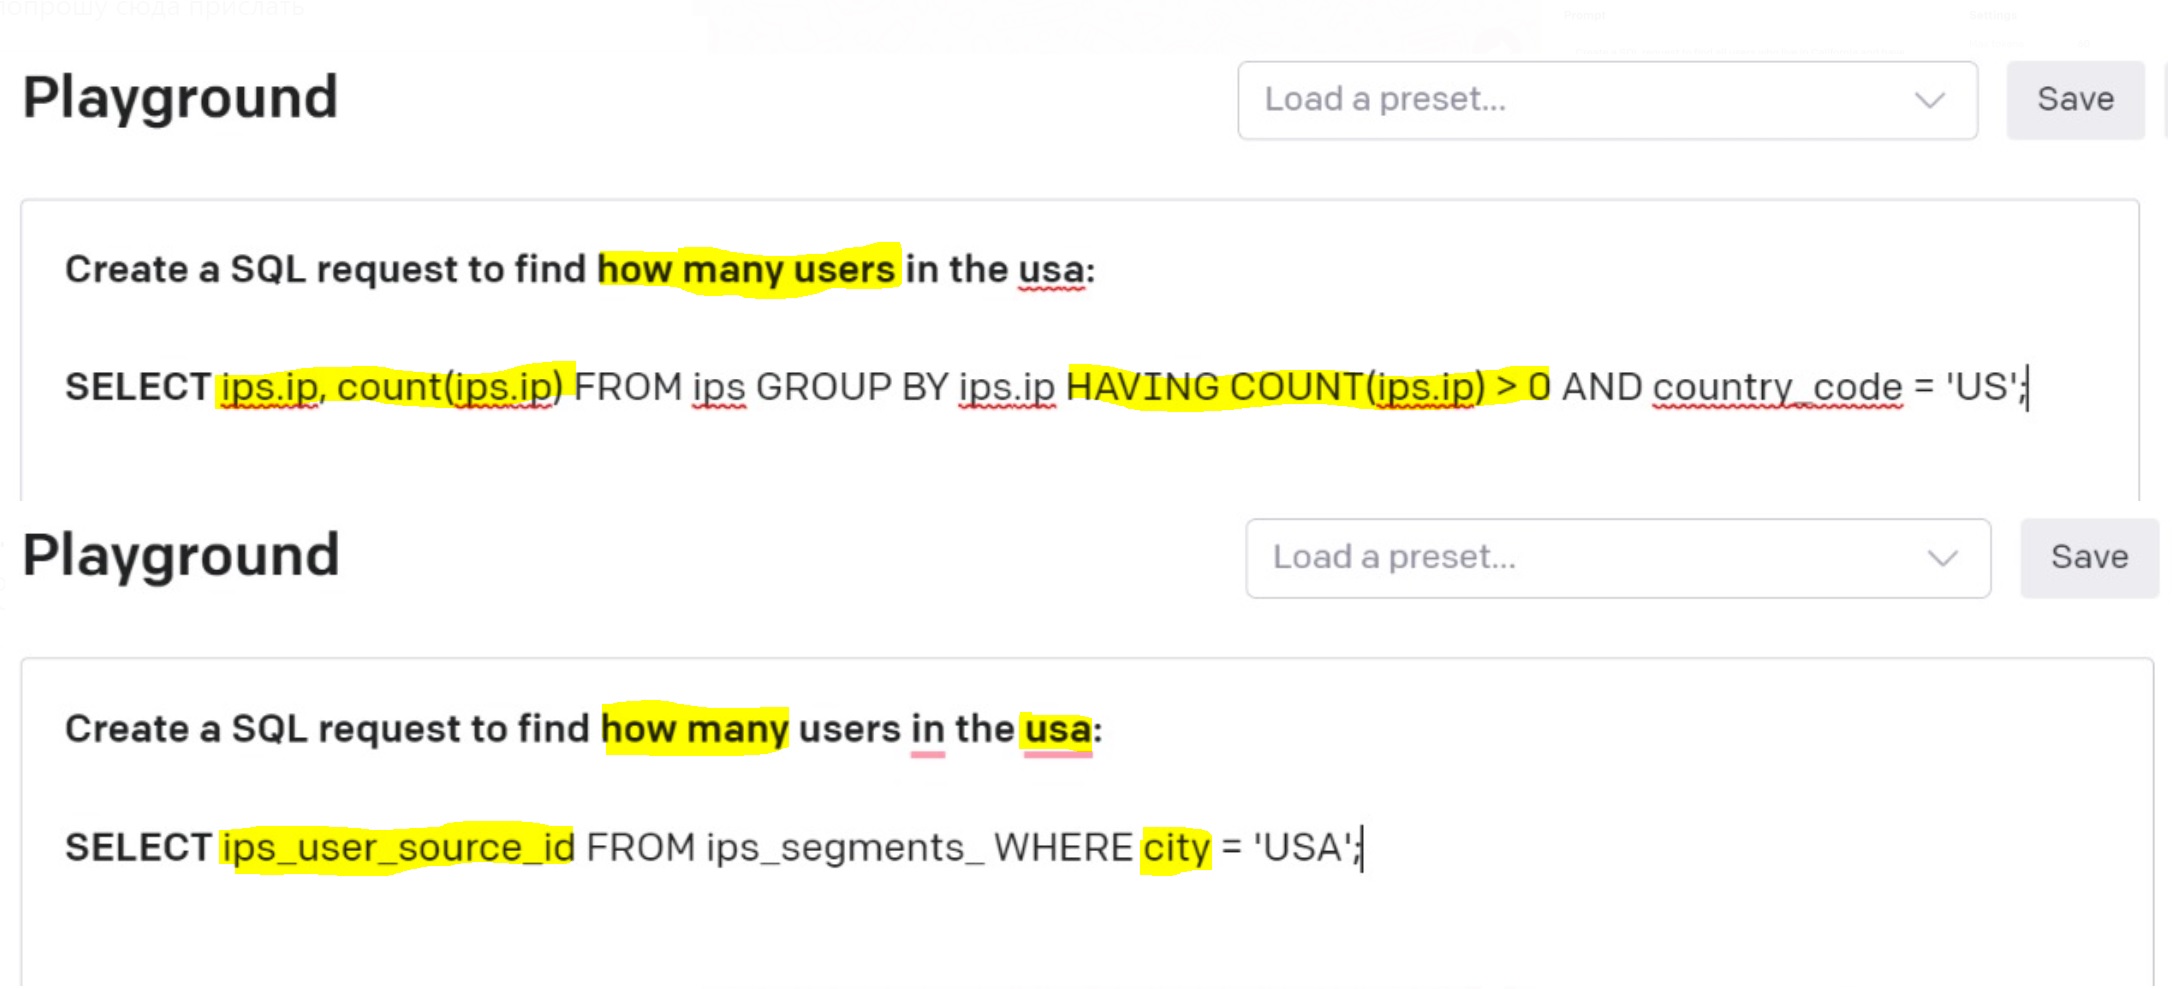
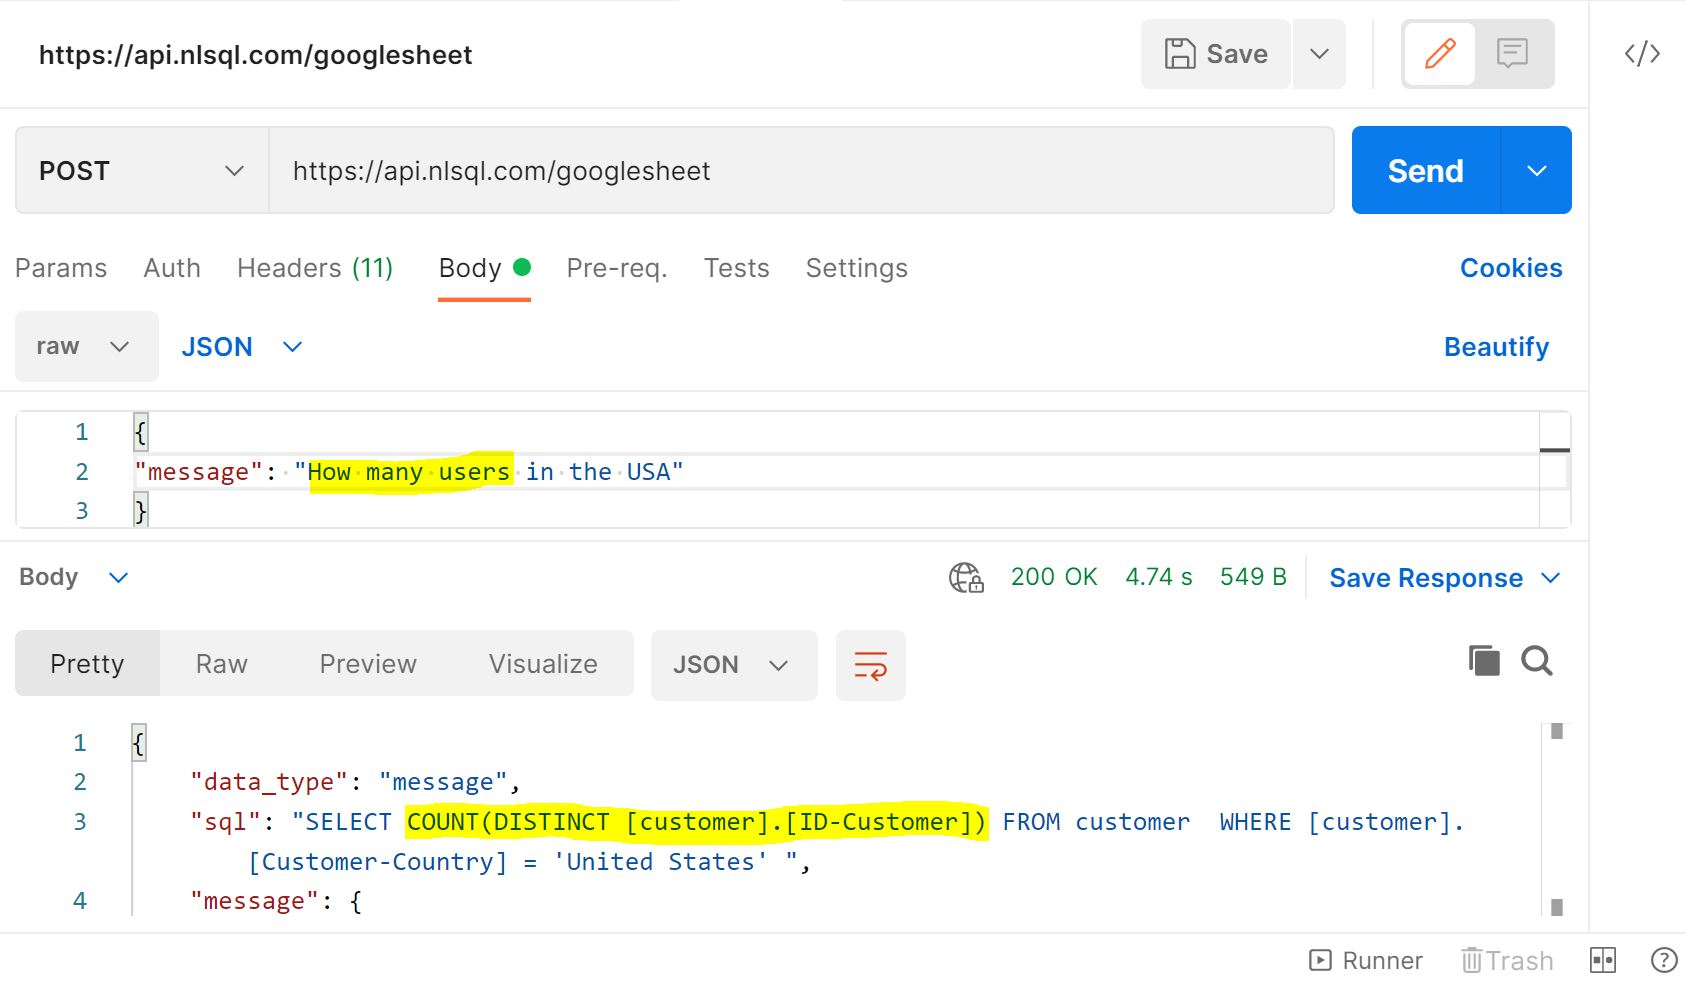
OpenAI SQL Query generation based on Natural Language input AI turned our inaccurate for a really simple question "to find how many users in the USA?". We've posted a few screenshots with GPT-3.5 results. Also, we've attached accurate results for the same question from our NLSQL software.
More:
TRY LIVE NLSQL DEMO NOW
Amazon QuickSight Q vs NLSQL comparison
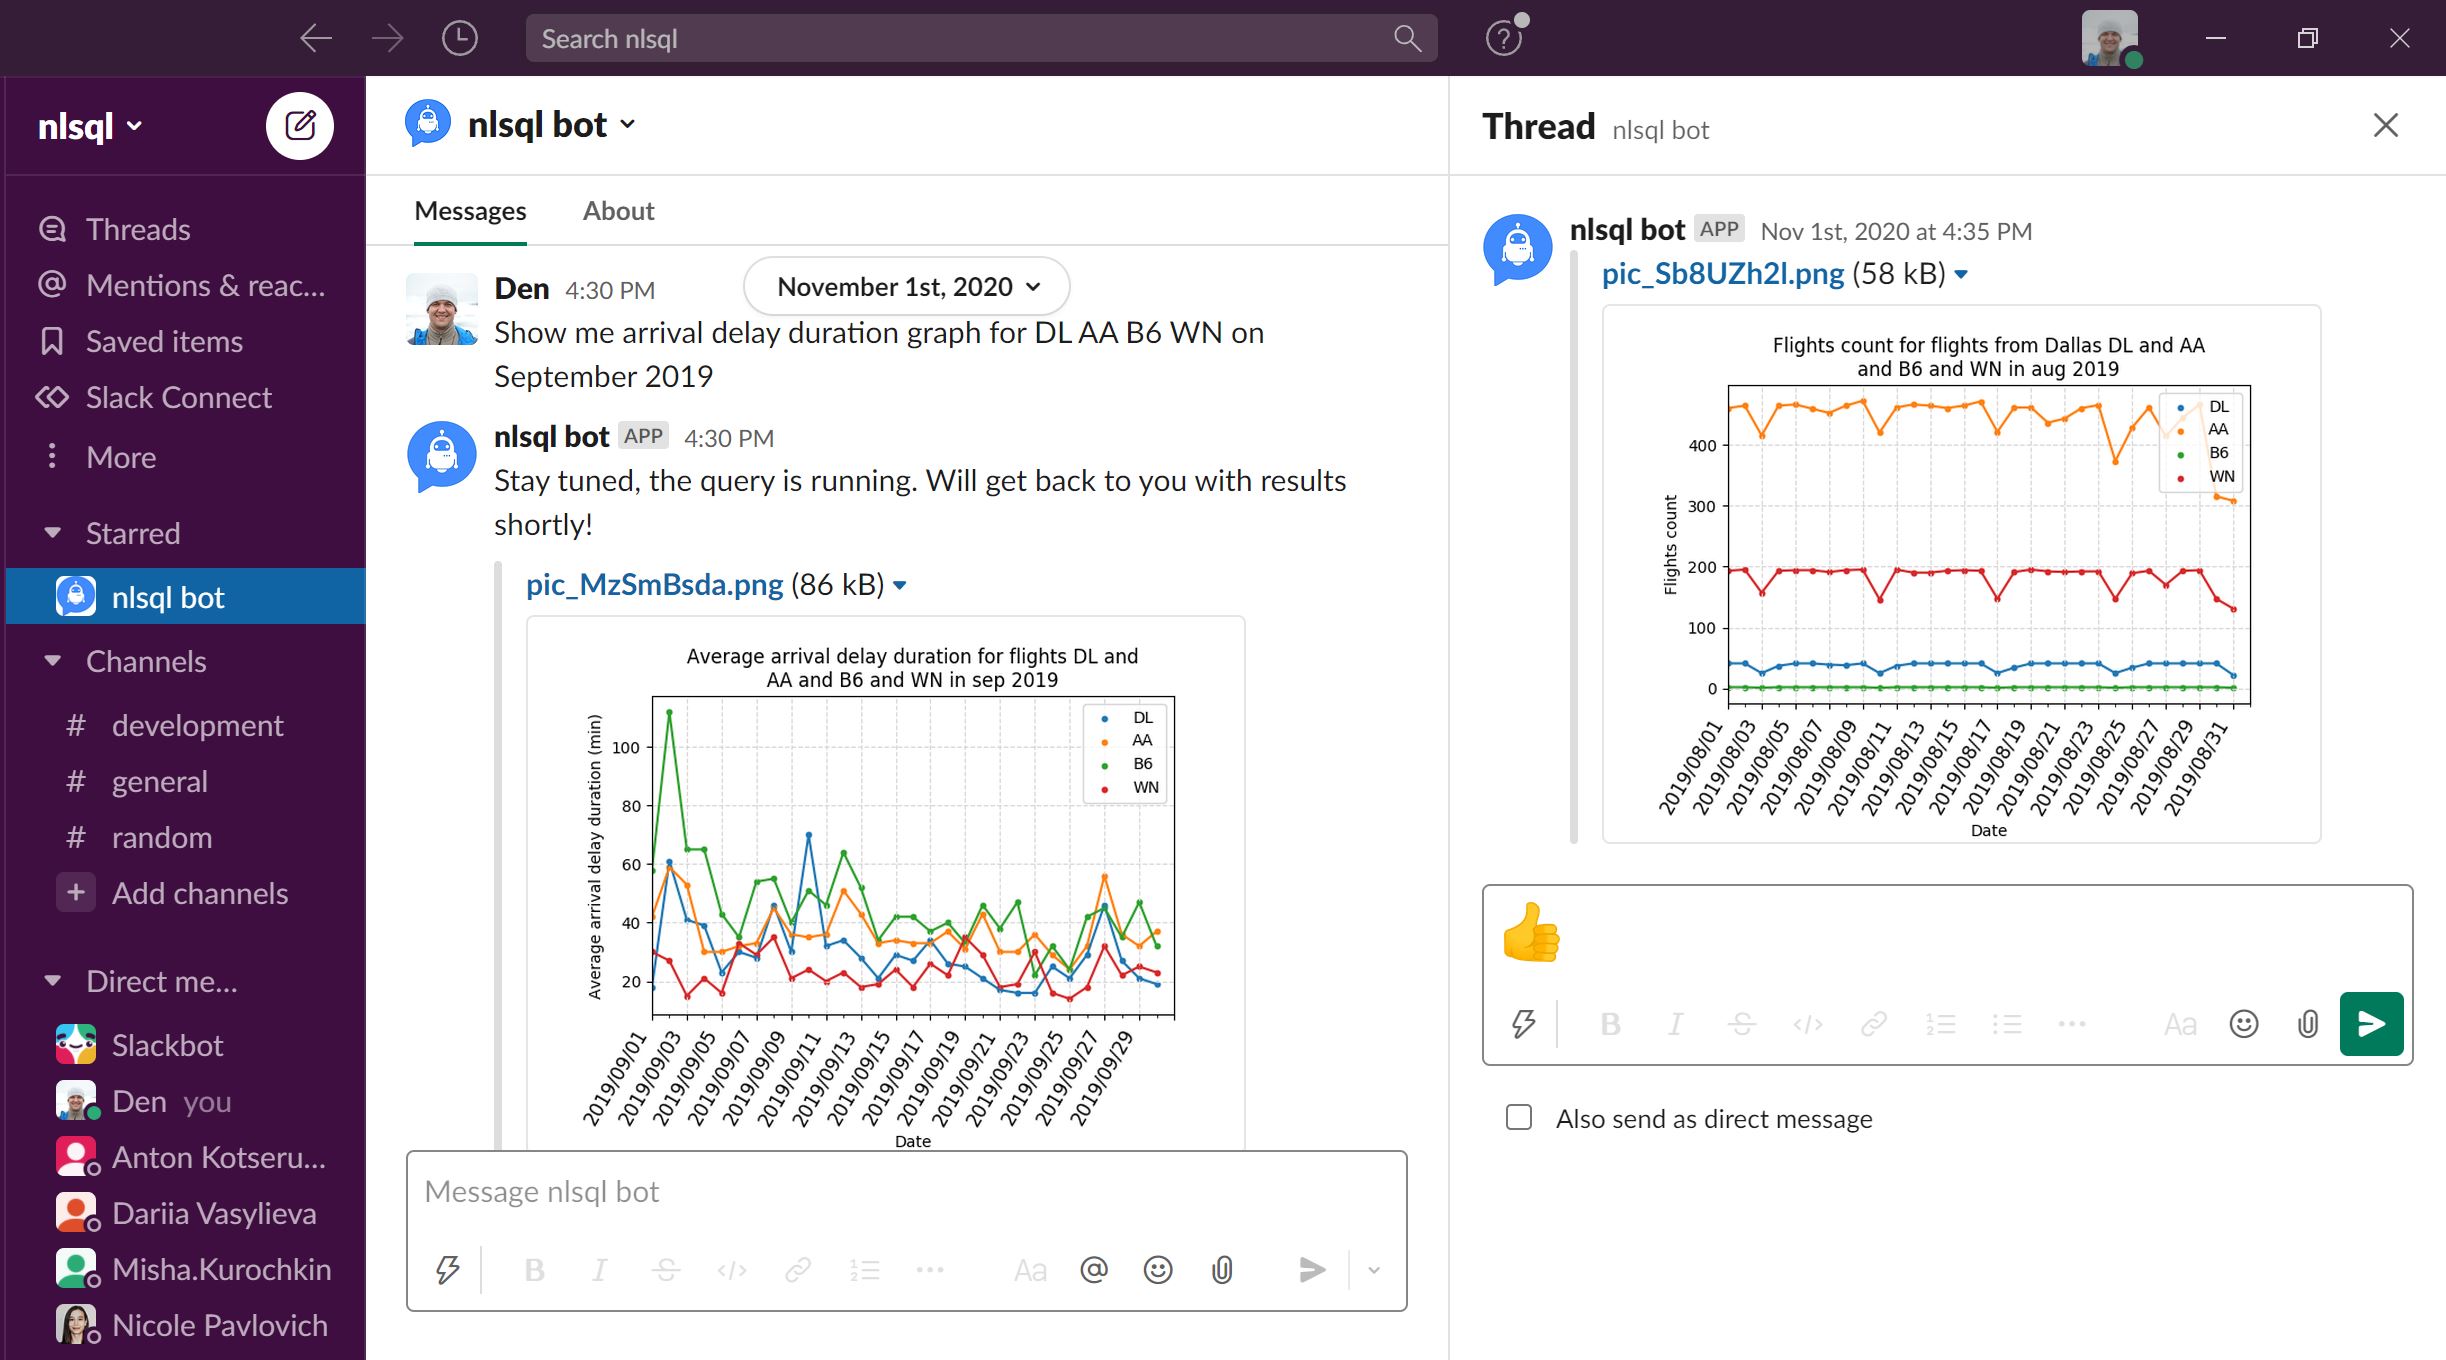
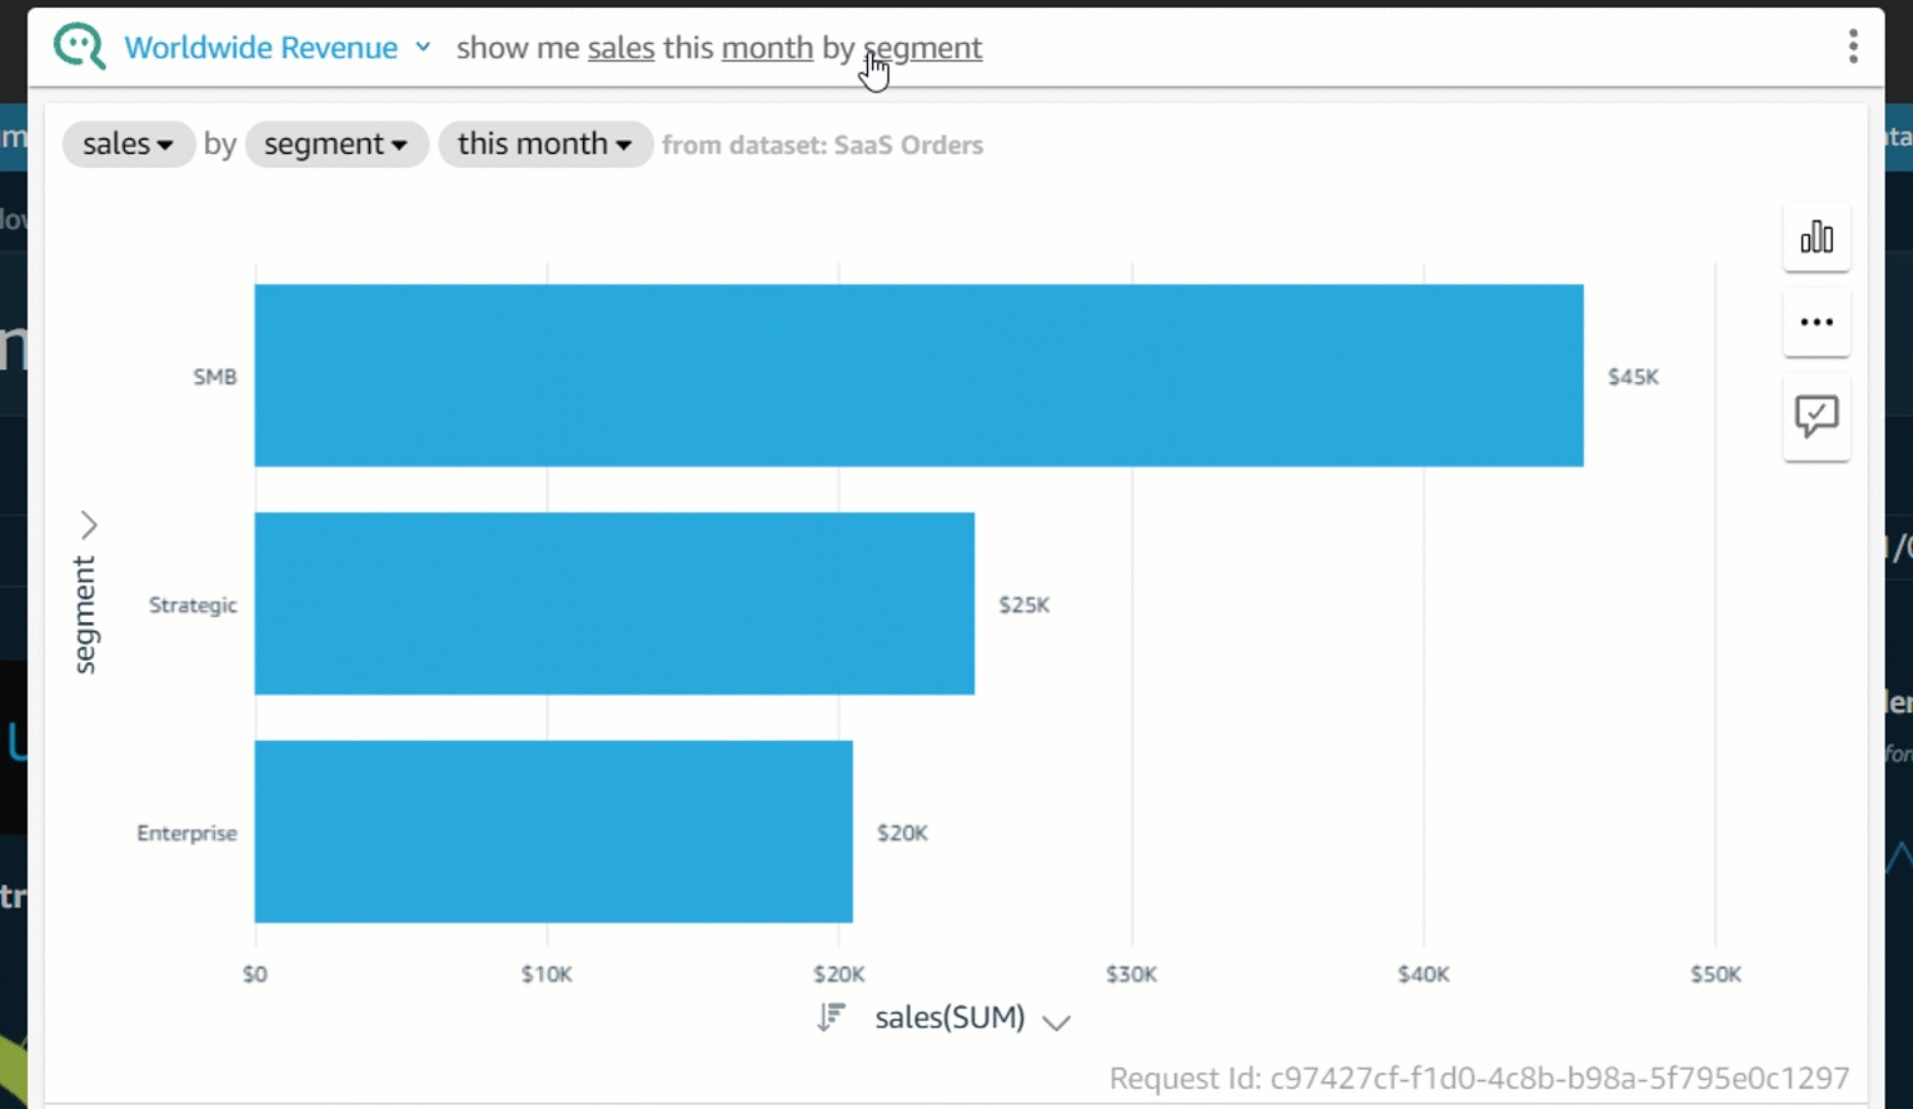
Amazon QuickSight Q vs NLSQL is always a crucial battle for empowering employees with data analytics. NLSQL provides plenty of database integrations and user interfaces, likewise MS Teams, Slack, self-service NLP to SQL API, custom web or mobile app chat support, etc. On the other hand, Amazon QuickSight Q is well focused on Redshift and Amazon QuickSight's front-end interface.
Do you know that in the past, business professionals relied on the data analytics department to generate any report that was generated from the company database? However, with the development of NLSQL and Amazon QuickSight Q, employees can now build any report using only natural language questions.
Both of these tools provide a variety of features, strength, and also have their own merits and demerits. But these tools are growing faster as the tools created for solving challenging problems of natural language understanding and SQL code generation. In order to solve …
More:
TRY LIVE NLSQL DEMO NOW