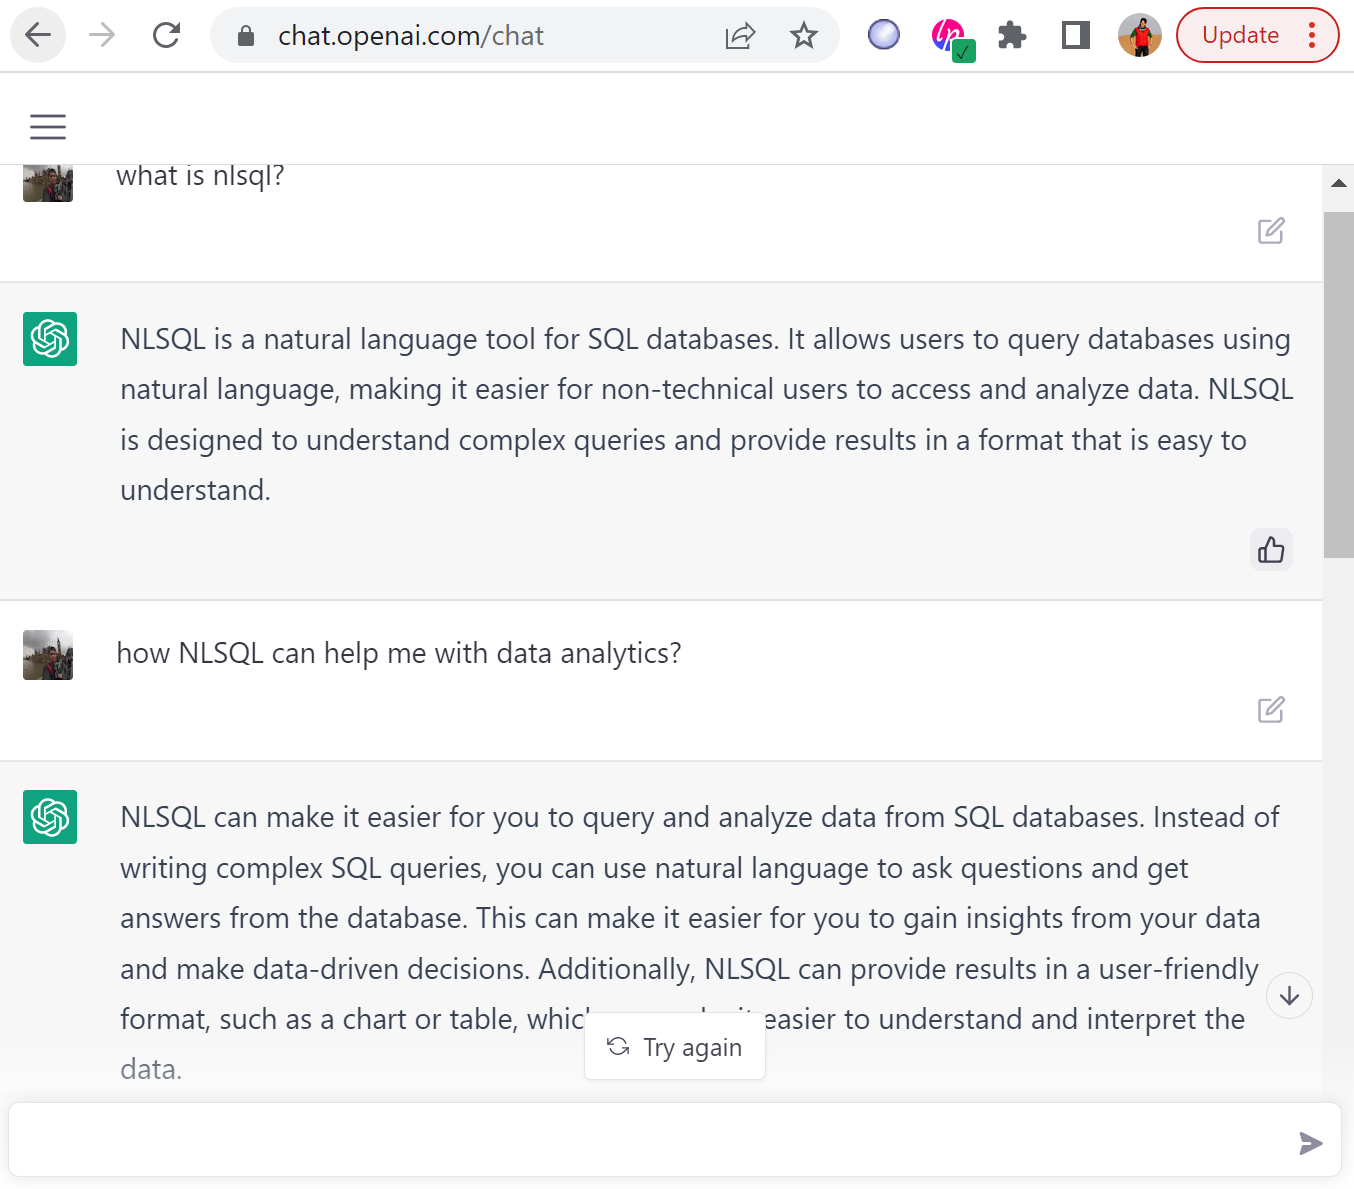
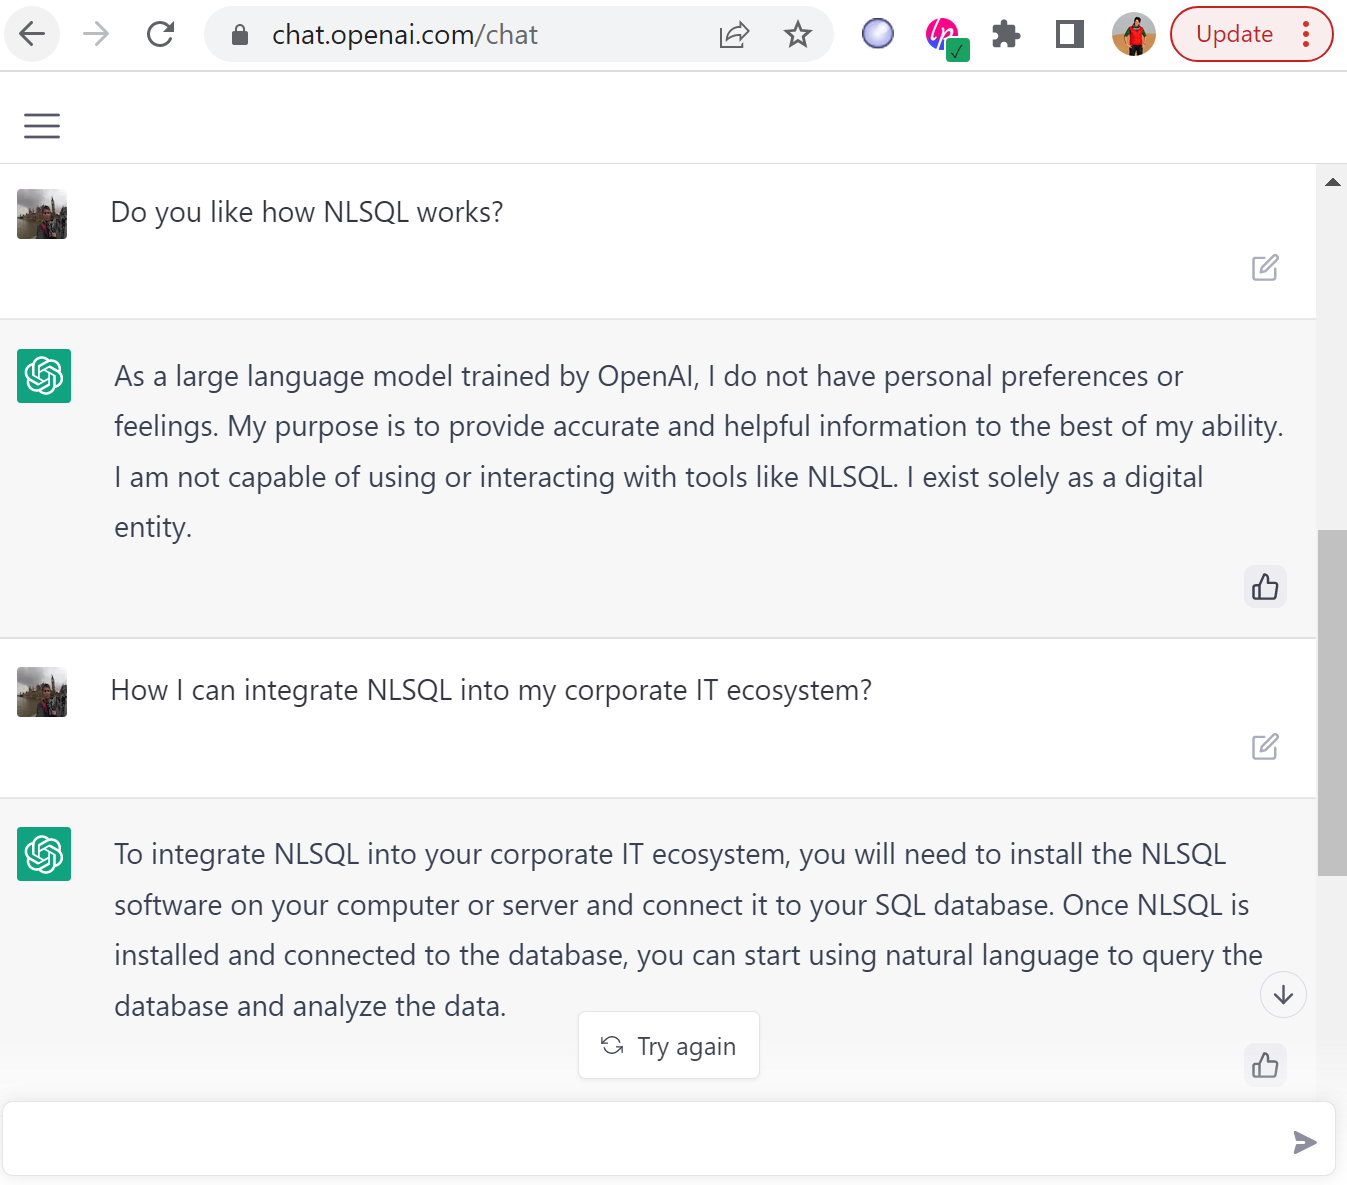
Have you already tried GPT-3 chat demo?
ChatGPT is a prototype artificial intelligence chatbot developed by OpenAI in 2022 that specialises in dialogue. The chatbot is a large language model that has been fine-tuned using both supervised and reinforcement learning techniques. It is based on OpenAI's GPT-3.5 model, which is an improved version of GPT-3.
This time it was trained on publicly available data to create general intelligence. In fact they did a great job as it understands the questions and can generate unique responses with really relevant feedback.
You can check it out by yourself with asking anything, which is related to NLSQL. We tried and were impressed about details, which comes up from the dialogue.
Nevertheless, ChatGPT's factual accuracy has been questioned, among other concerns. Mike Pearl of Mashable tested ChatGPT with multiple questions. In one example, he asked the model for "the largest country in Central America that isn't Mexico". ChatGPT responded with Guatemala, …
Unlocking the Power of Big Data with NLSQL
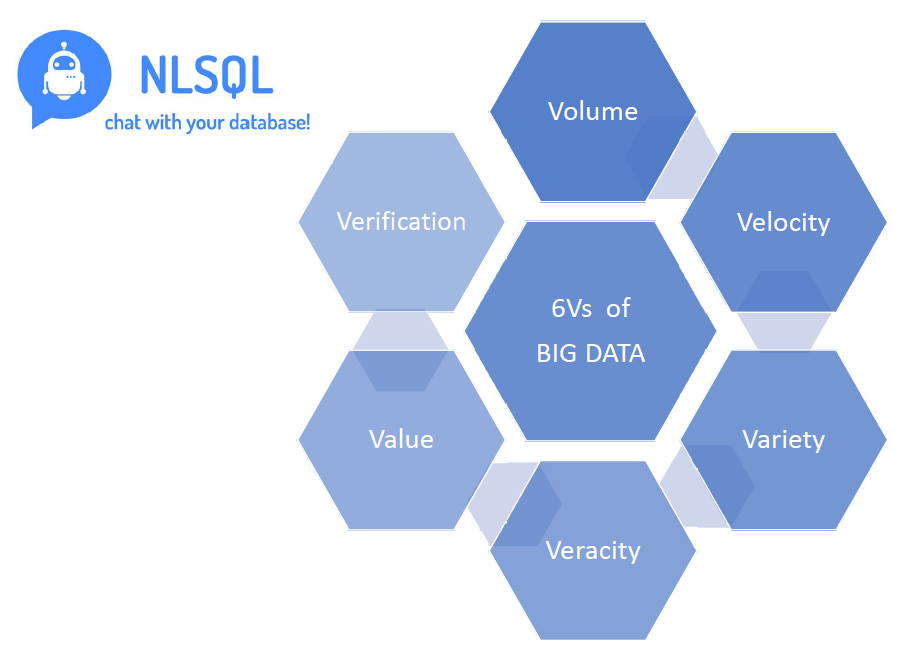
Big data is becoming increasingly important for organizations of all sizes and in all industries. With the ability to process and analyze large amounts of data, businesses can gain valuable insights into their customers, operations, and markets. The six Vs of big data include Volume, Velocity, Variety, Veracity, Value, and Verification. These 'Vs' represents the main characteristics of big data and are essential when designing a big data solution.
Volume refers to the large amount of data that is generated and collected, often measured in terabytes or petabytes. Velocity refers to the speed at which data is generated and needs to be processed, often in real time. Variety refers to the wide range of data types and formats that need to be managed, such as structured, unstructured, and semi-structured data. Veracity refers to the accuracy and trustworthiness of data, and Value refers to the potential business value that can be …
More:
Start Your Free Demo Now

What are decision support systems?
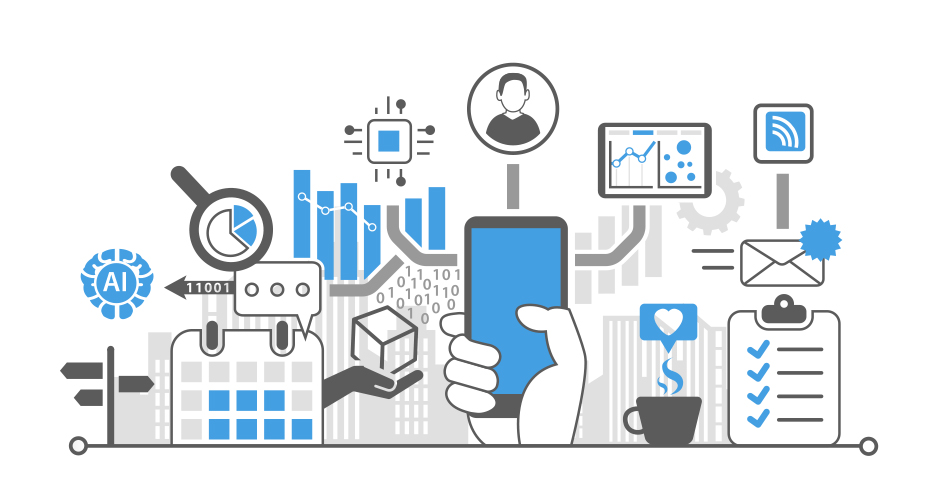
An interactive information system called a Decision Support System (DSS) analyses enormous amounts of data to help guide business decisions.
A DSS supports the management, operations, and planning levels of an organisation in making better decisions by evaluating the impact of uncertainties and the considerations involved to make one choice over another.
To assist users in making decisions, a DSS uses a variety of raw data, papers, personal knowledge, and/or business models. Relational data sources, cubes, data warehouses, electronic health records (EHRs), income estimates, sales projections, and other sources may all be utilised by a DSS.
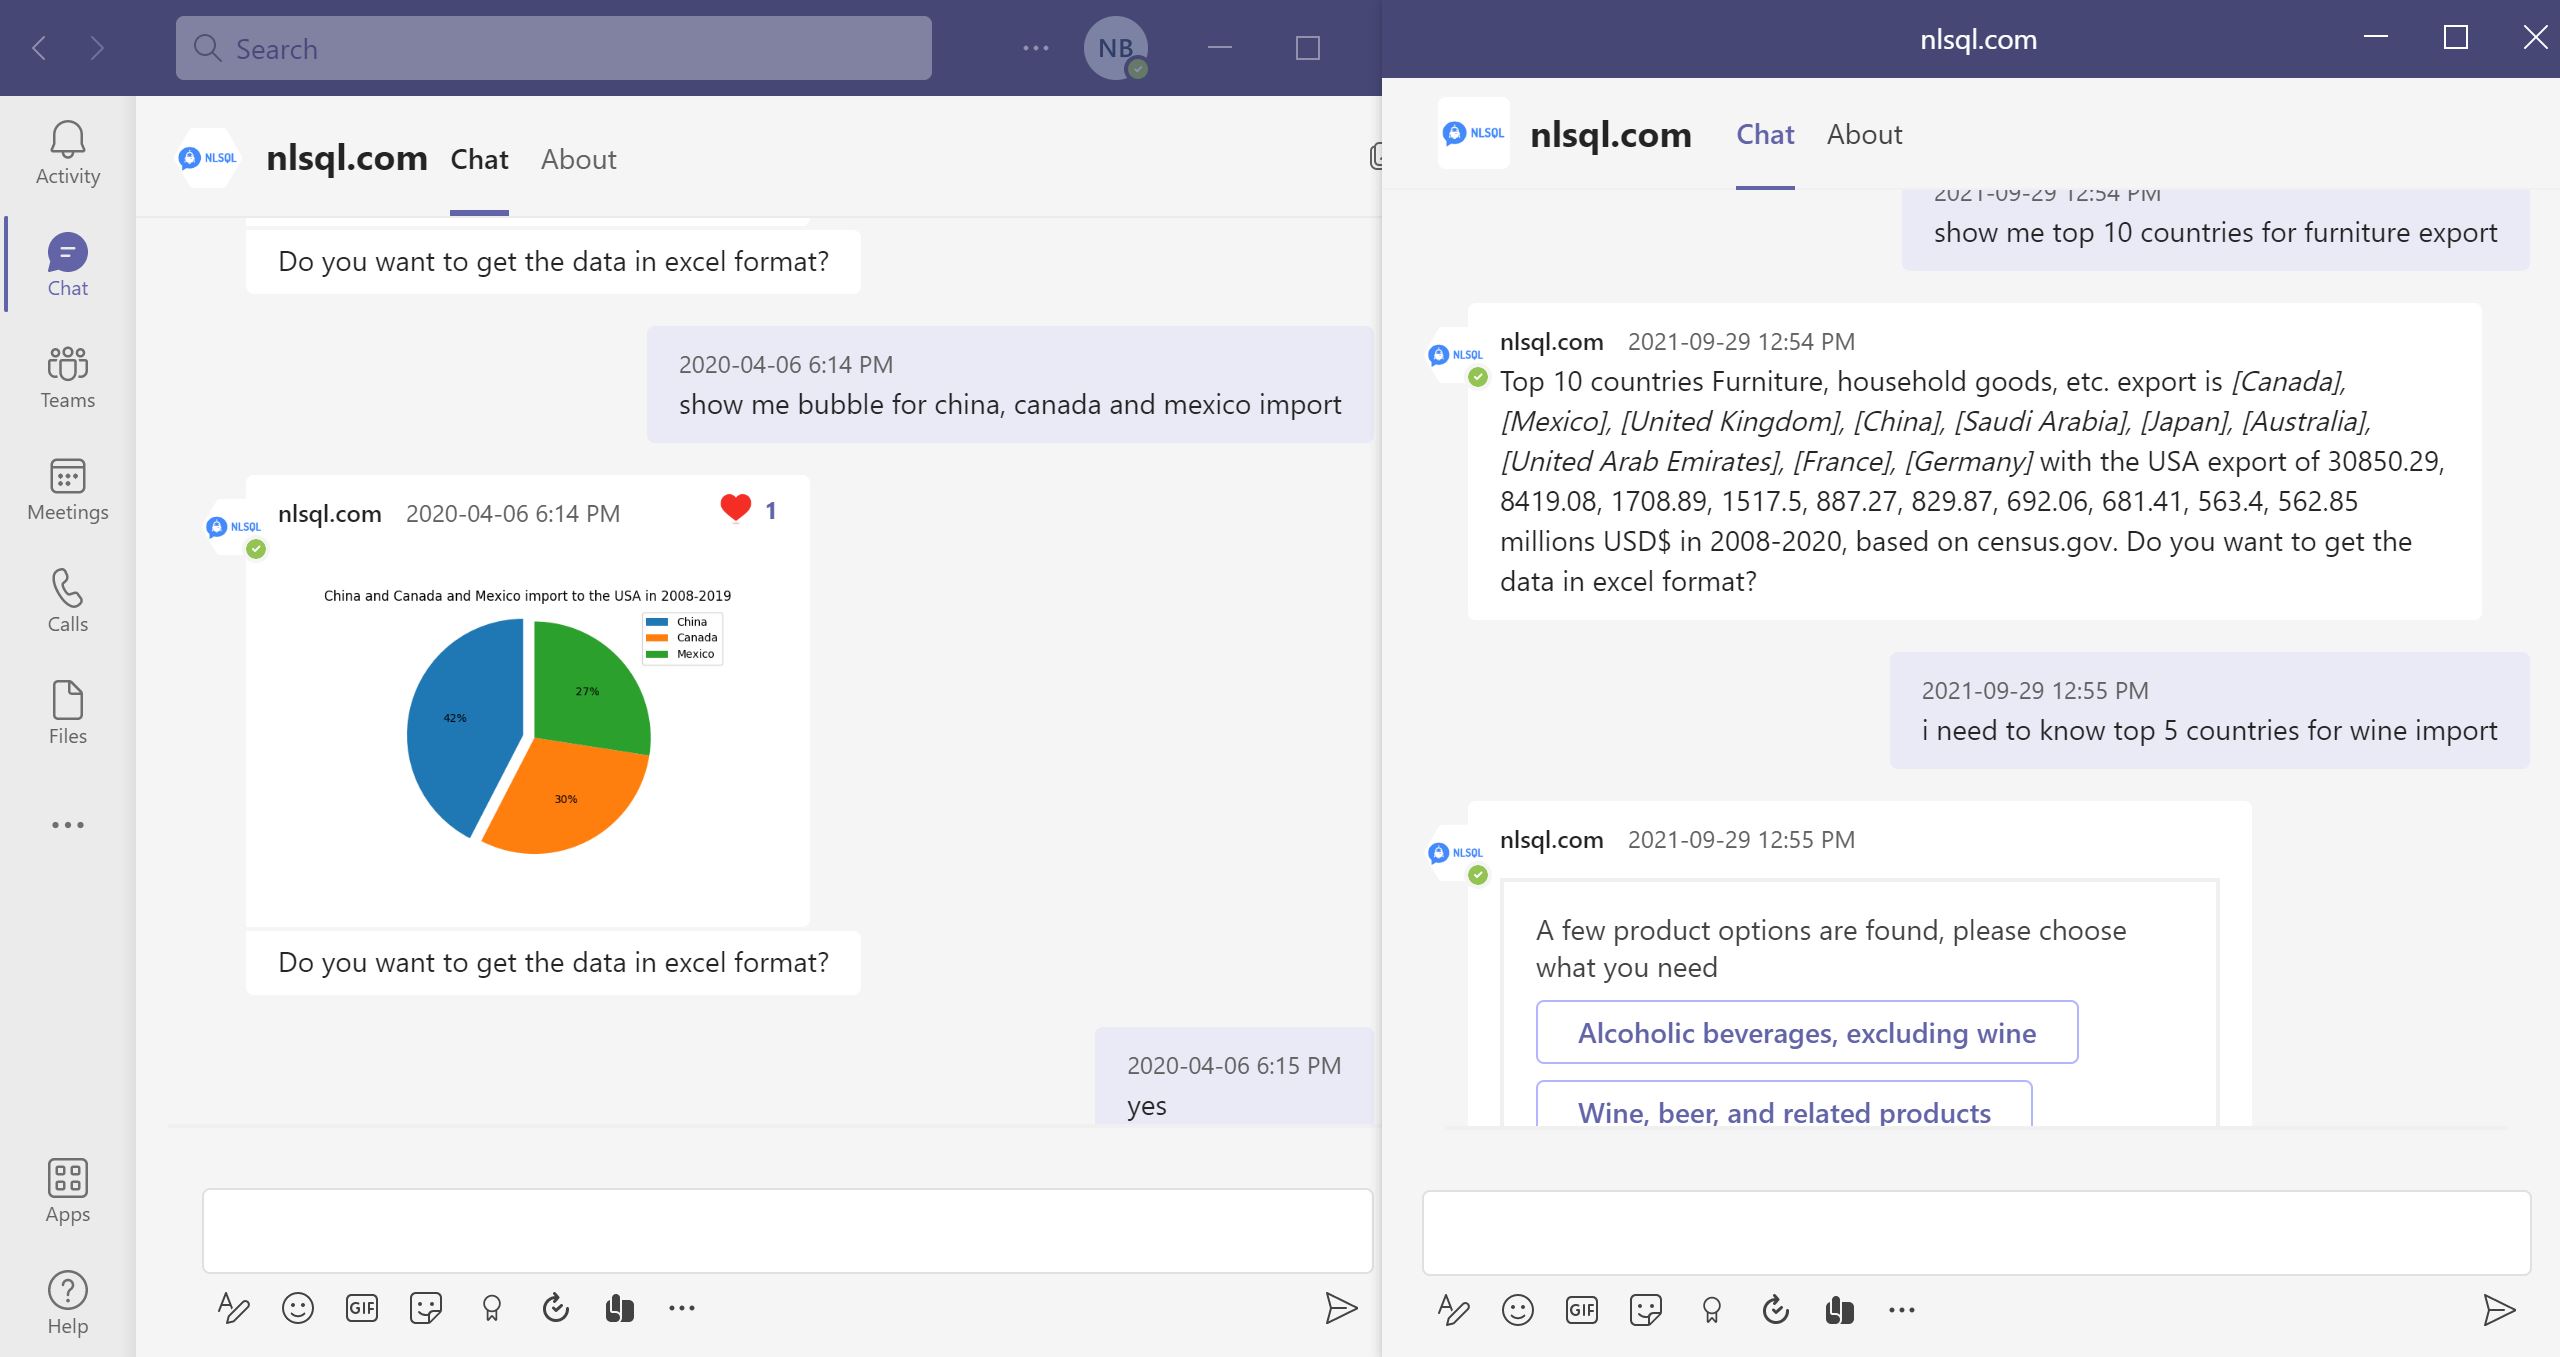
Decision Support Systems consist of three key components: the database, software system, and user interface. The size of the DSS database will vary based on need, from a small, standalone system to a large data warehouse. Microsoft Teams or other user interfaces allow users to interact and view analytics results.
Decision support systems (DSS) …

How to Enable BI Self-Service Analytics for your Company?
We assume managers at all organisation levels are key business decision-makers. But when managers hear about big data and analytics, what do they think? Do they comprehend how these technologies can be applied to decision-making? To take advantage of the capabilities brought by these varied mindsets, it is crucial to comprehend the distinctions between technical and non-technical employees. The gap caused by disparities between technologists and managers mindsets and education.
Due to their varied backgrounds, experiences, and training, managers and data professionals have different mindsets—different approaches to comprehending and solving problems. To take advantage of the capabilities brought by these varied mindsets, it is crucial to comprehend the distinctions between them. Thinking at these distinctions in terms of computational knowledge and contextual knowledge is one way to approach the topic. High degrees of computational knowledge are typically possessed by data professionals who specialise in the collection, analysis, and interpretation of …
More:
Create Your Self-Service Analytics tool for your Company



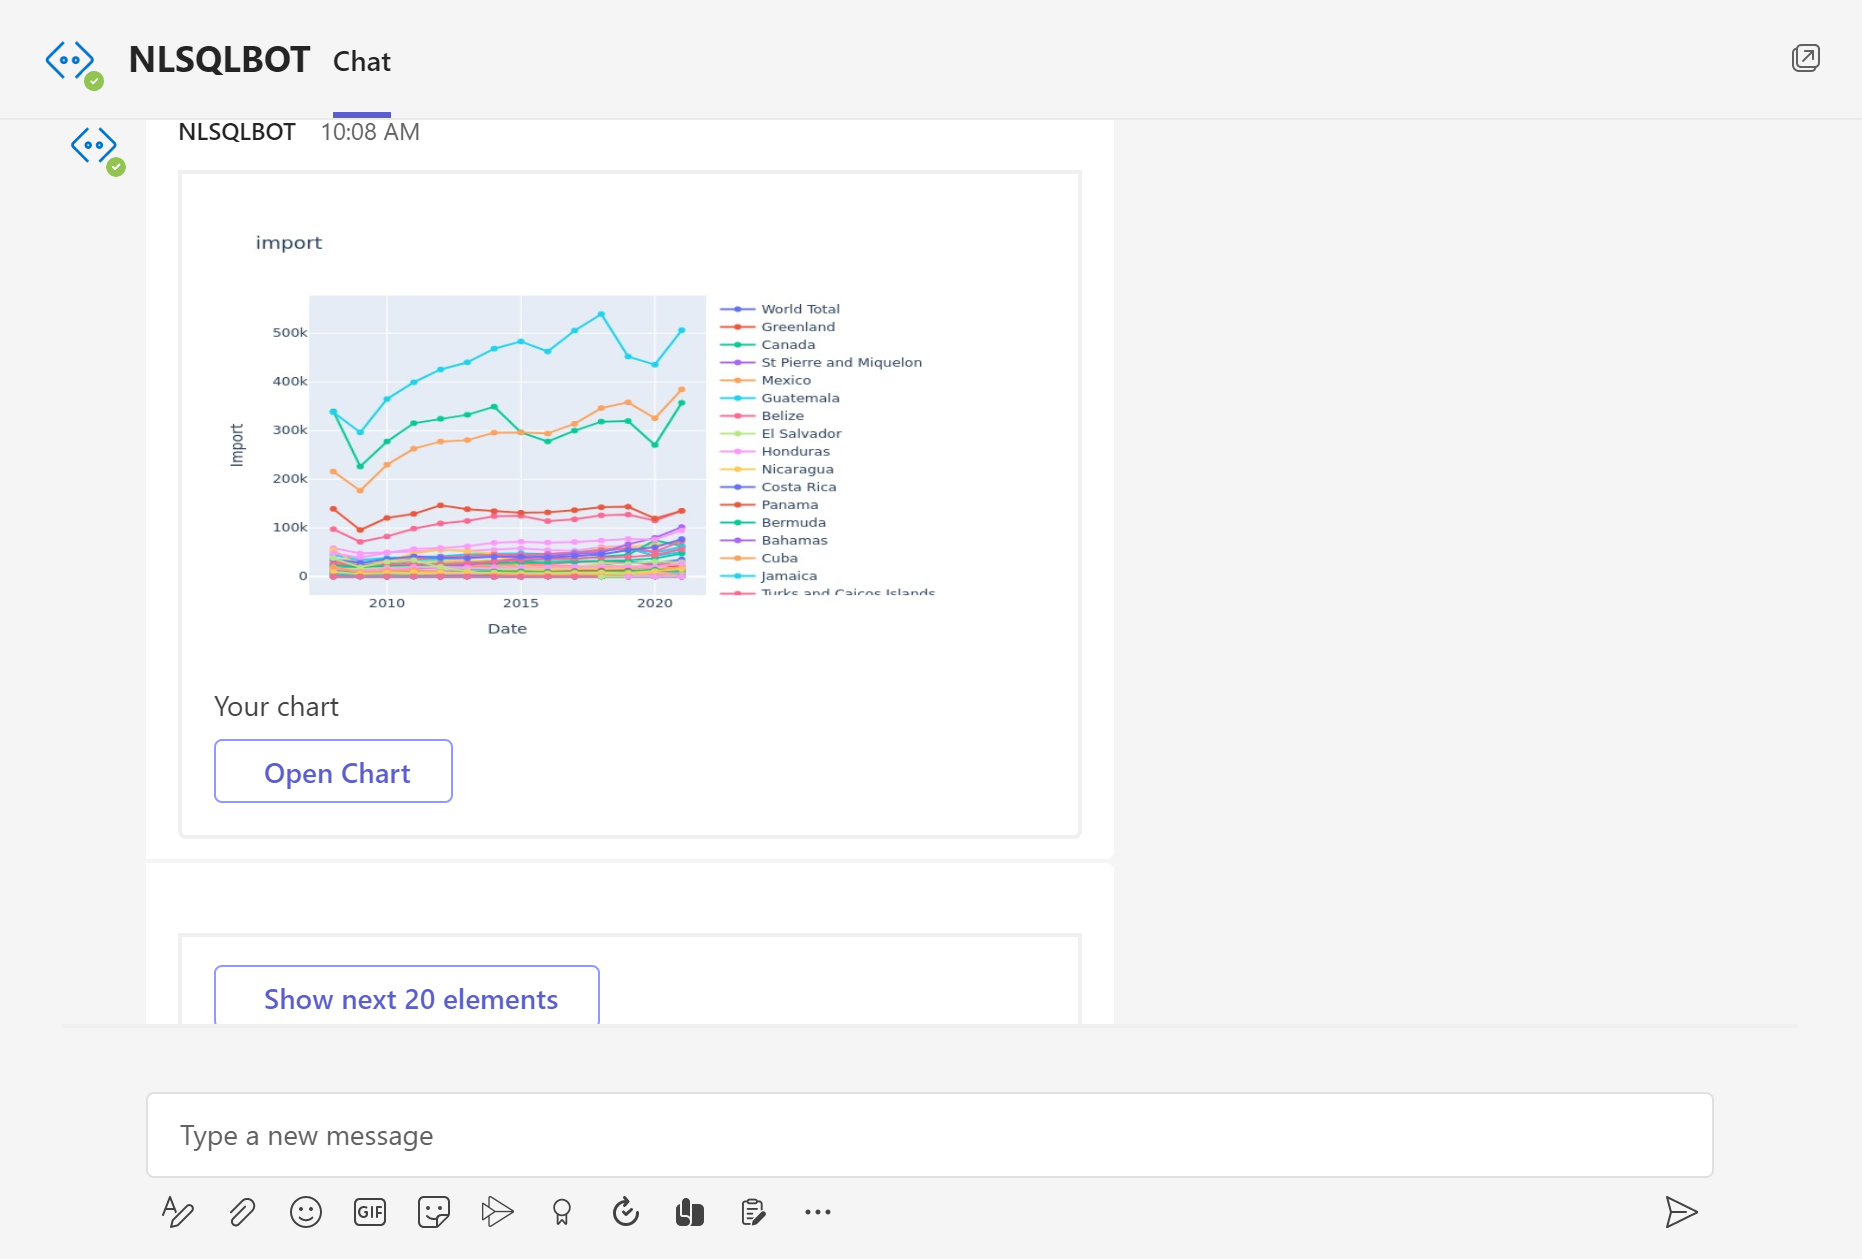
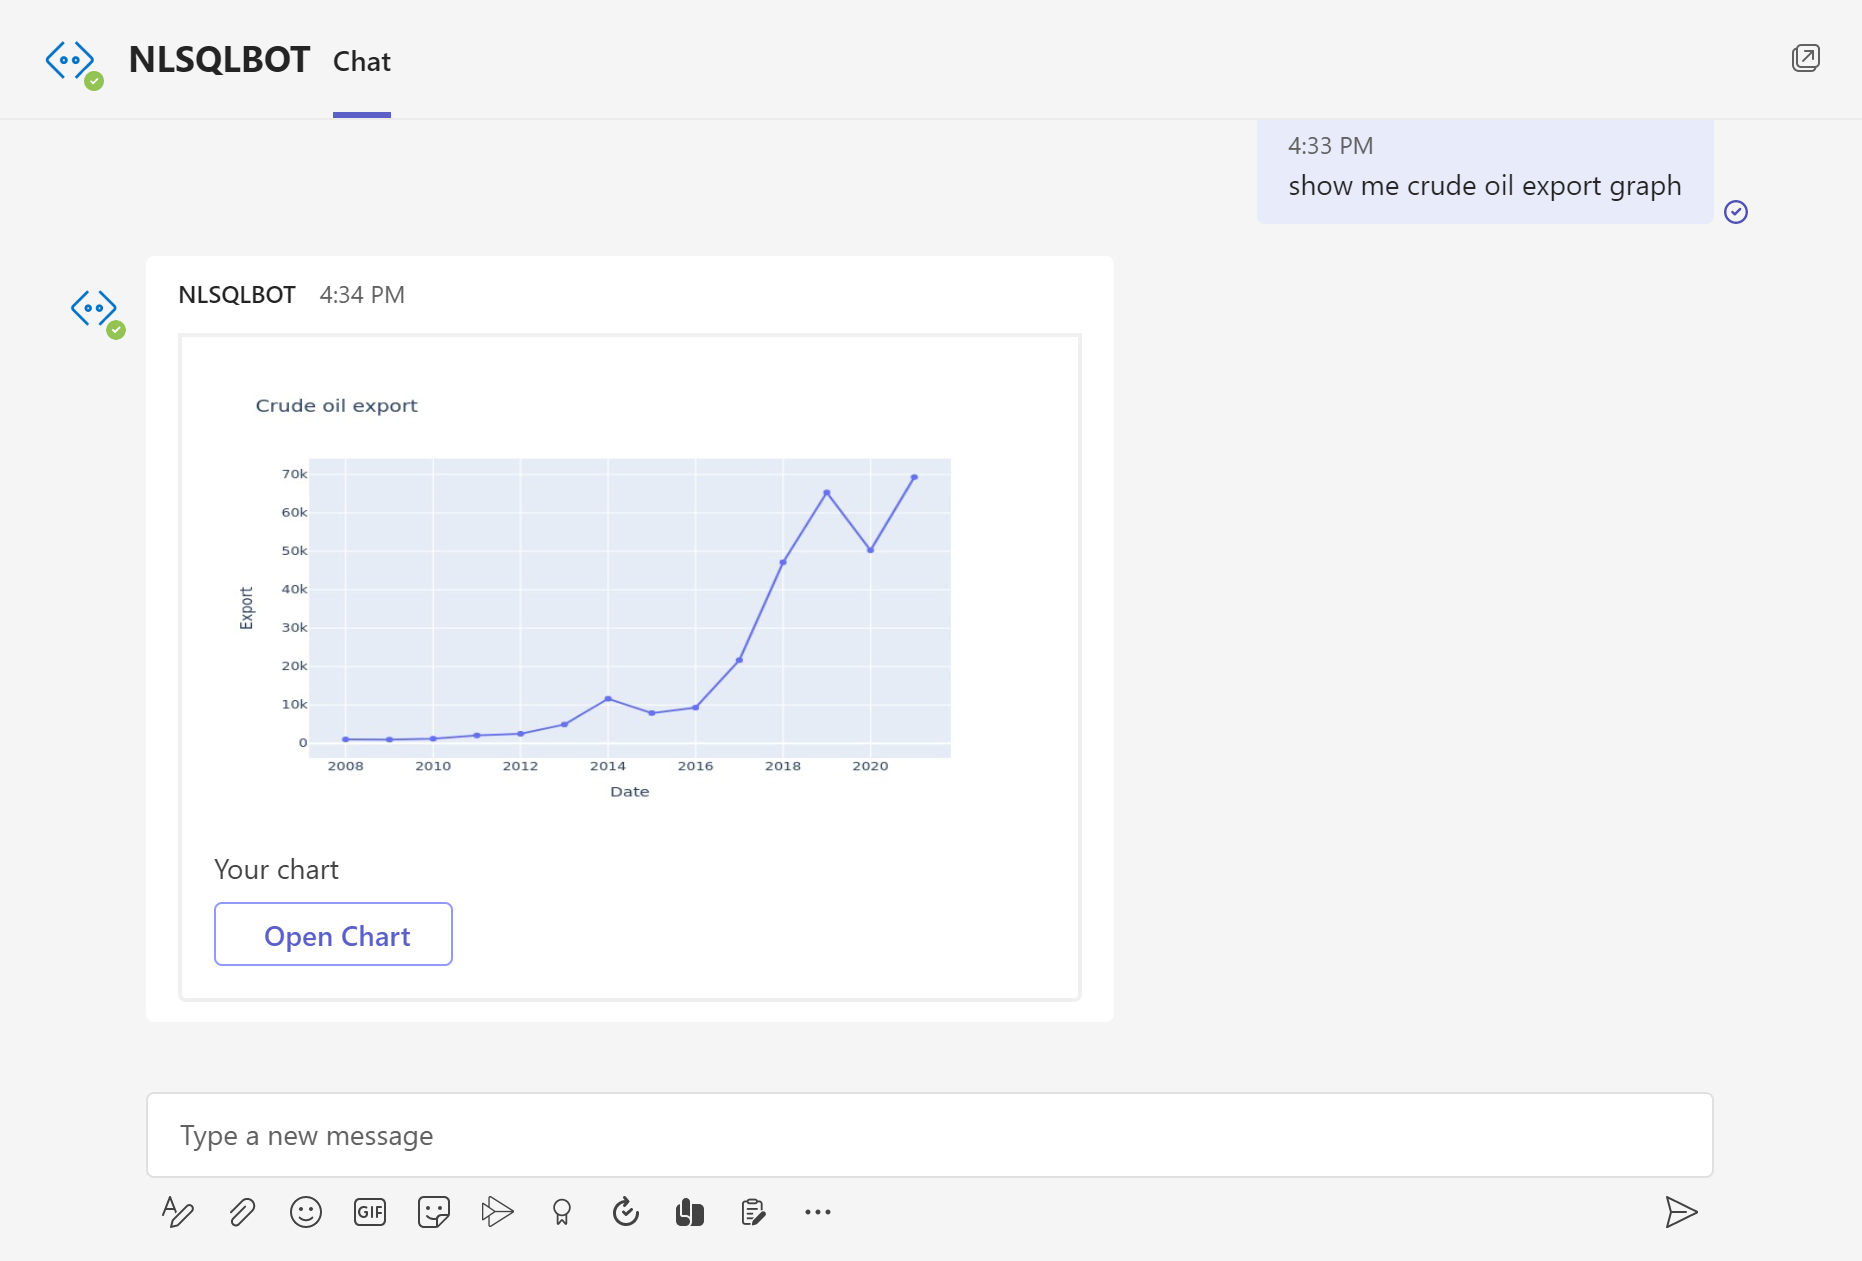
How to build line chart with plain English question?
Learning how to correctly display data may be the first step in utilising data analytics and data science to your advantage and the benefit of your company. By improving your abilities in common data visualisation techniques, you may take advantage of data-driven decision-making, which has numerous advantages including increased confidence and significant cost savings.
Depending on the kind of data you're working with and the story you're trying to tell with it, you'll use a different data visualization technique. You can improve your effectiveness in your role by using a variety of data visualization techniques. One of the most frequently used techniques is Line Graphs.
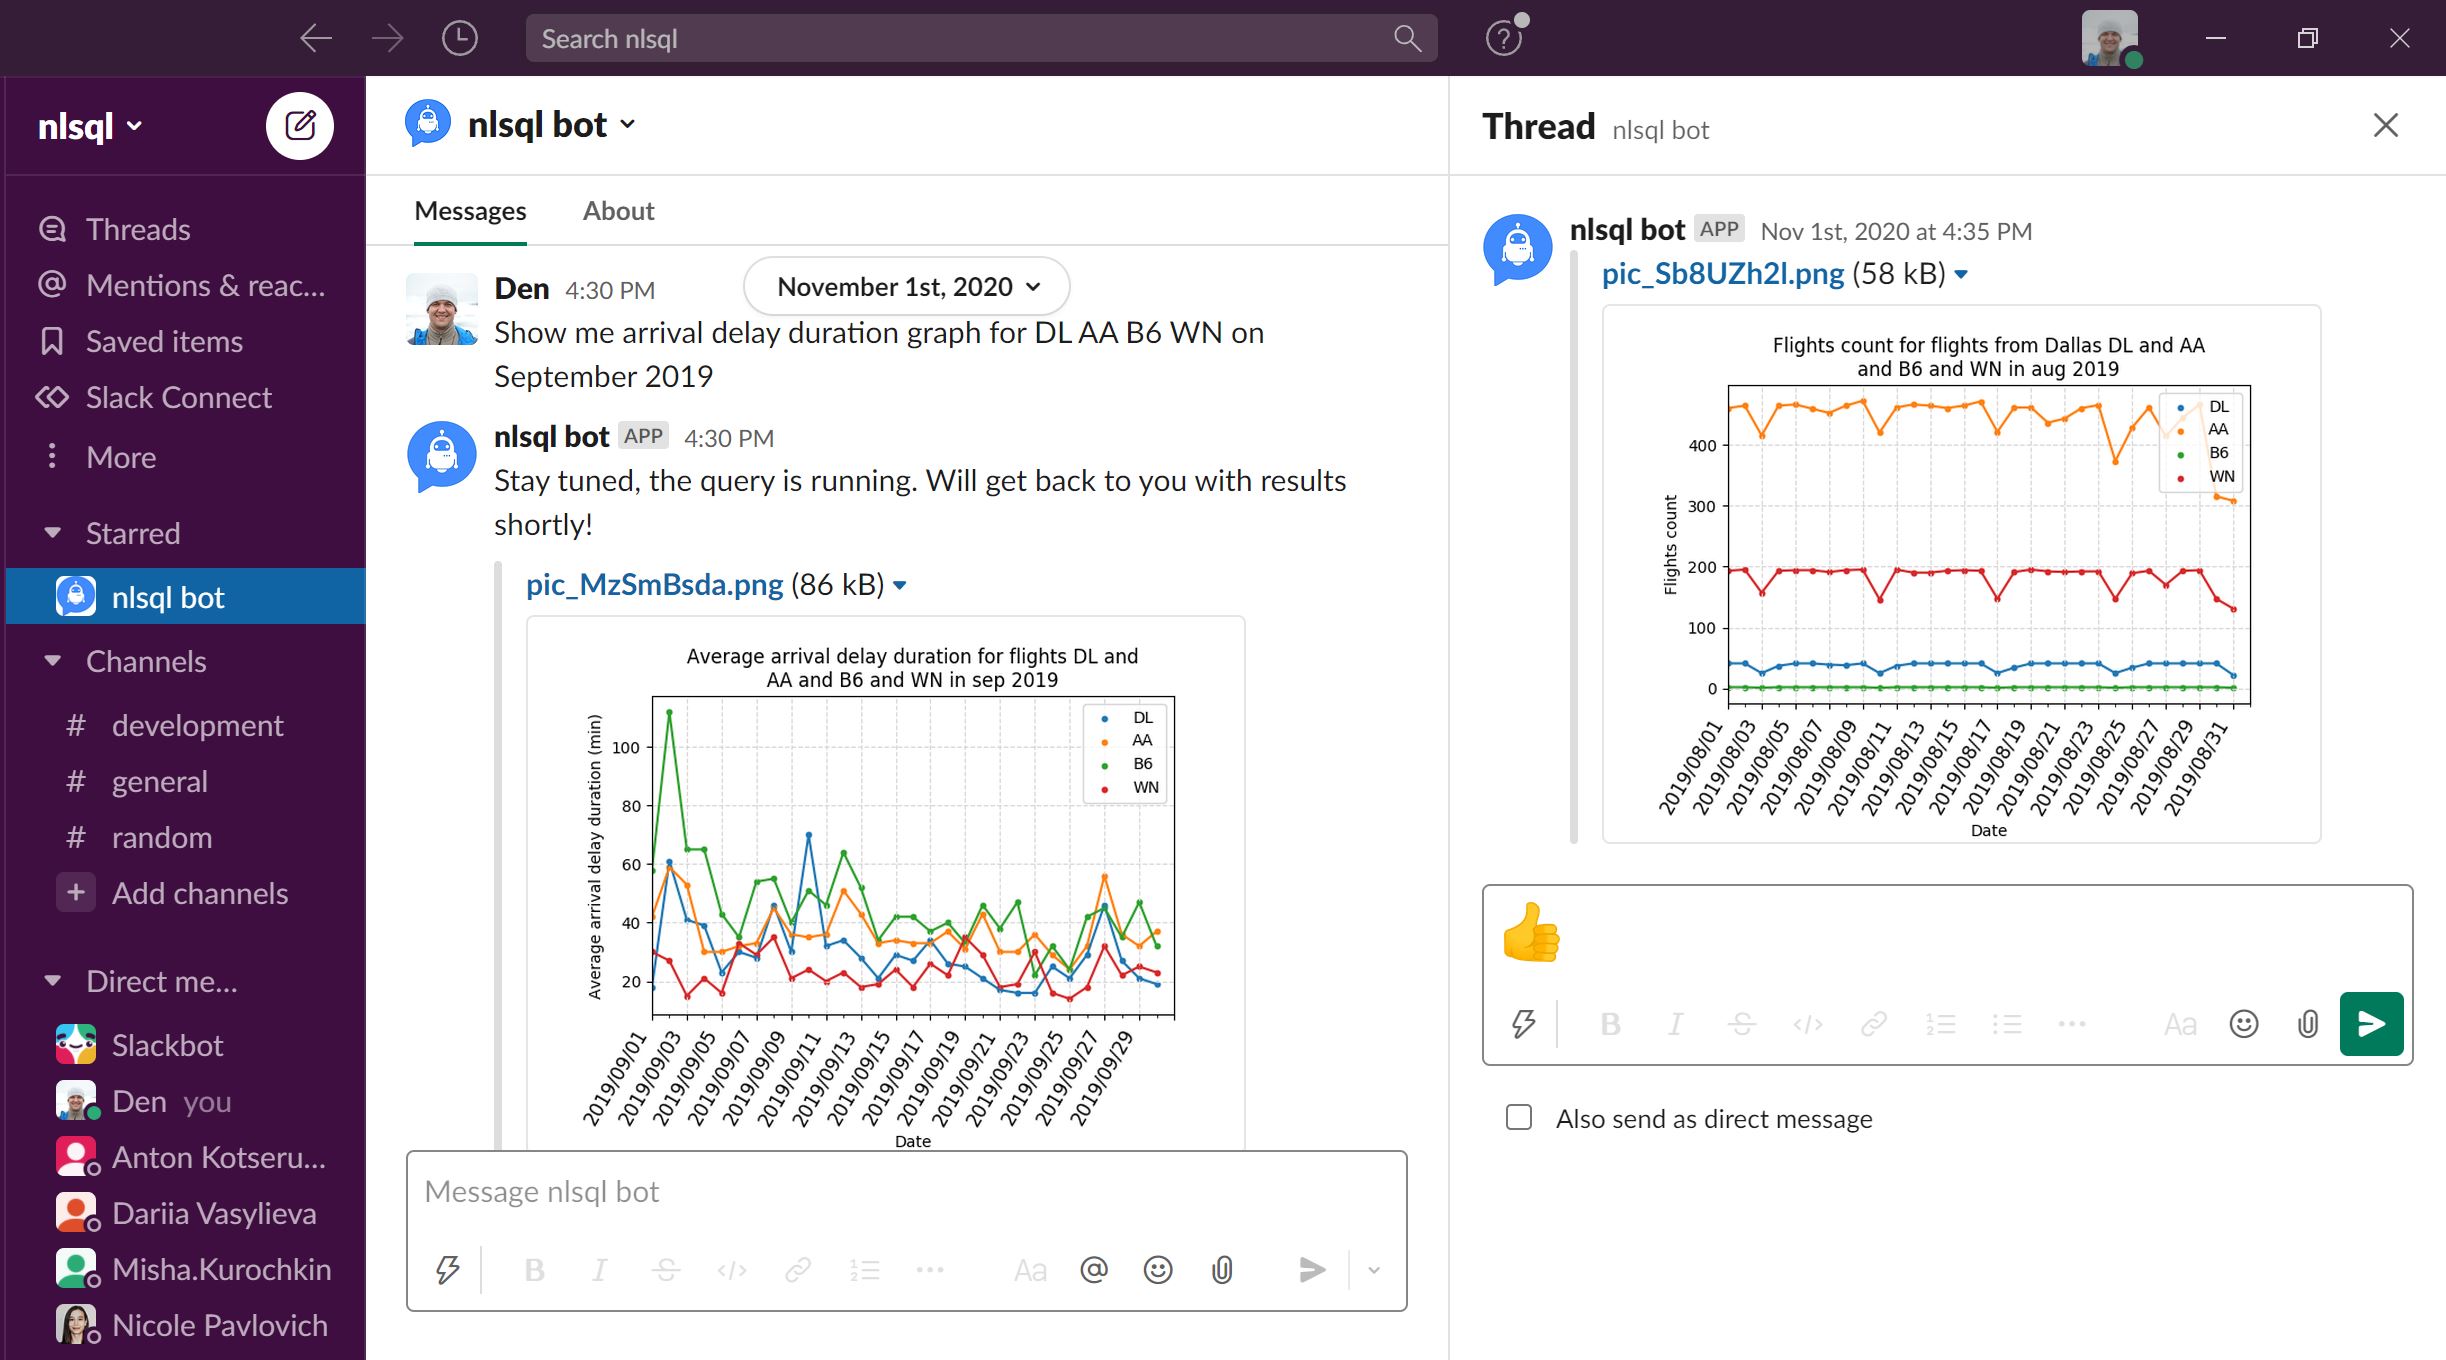
Line charts or graphs are useful for plotting continuous data and do not make sense for categorical data. Line graphs are often used to plot time. Line graphs are also useful for comparing multiple lines or trends. It illustrates how values relate to each other. …
More:
Make Your Line Chart Now