Revolutionise Your Business Data Accessibility and Analysis with GPT-4 and NLSQL
Generative Pre-trained Transformer (GPT) models, specifically the well-known GPT-3 and the GPT-4, have shown great potential in the field of Natural Language Processing (NLP) and can be used in a variety of business scenarios.
GPT-3, developed by OpenAI, is a powerful language model that has been trained on a vast amount of data. It can generate human-like text, making it suitable for a wide range of Natural Language Processing tasks such as language translation, text summarization, and conversation generation. In the business world, GPT-3 can be used to automatically generate product descriptions, customer service responses, and marketing materials. It can also be fine-tuned to understand specific business-domain language, making it even more accurate in understanding the context of a text.
The GPT-4 could potentially have even more capabilities than GPT-3. It would likely be trained on larger and more diverse data sets, and may have additional capabilities such as improved …
More:
Start Your Free Demo Now

Organize Data with Ease: An Introduction to the Structurizer Bot
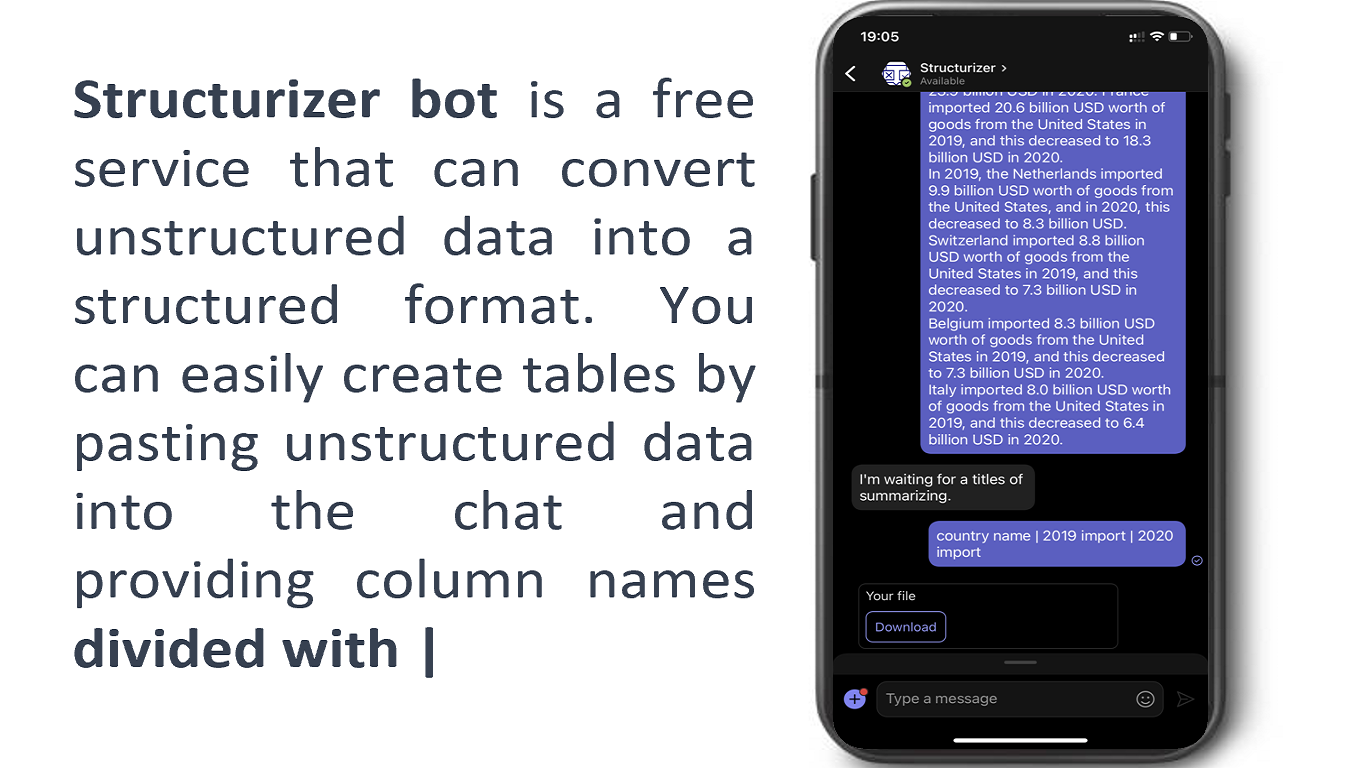
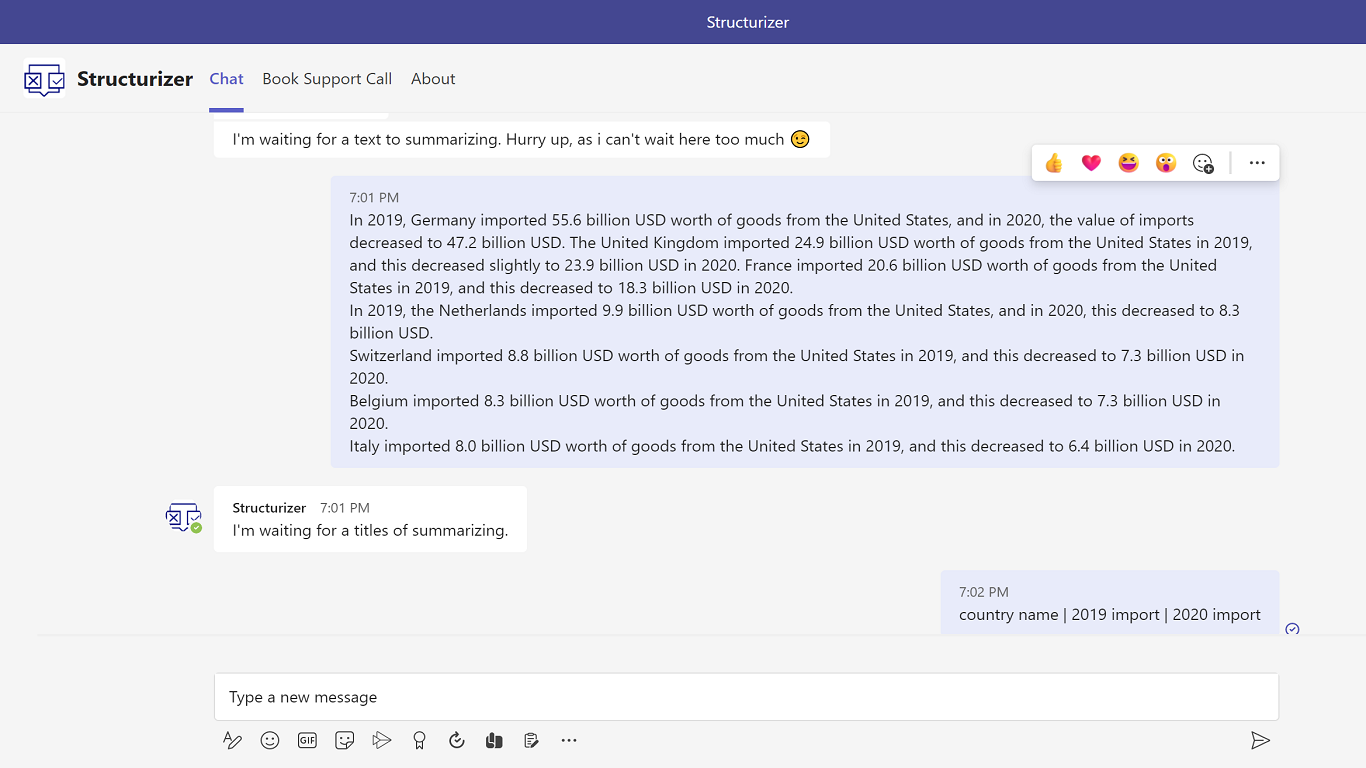
The Structurizer bot is an incredibly useful tool that can help you organize unstructured data into structured tables. With the help of this bot, you can easily categorize data and store it in an organized manner, which makes it much easier to analyze and use.
The Structurizer bot is available on Microsoft Teams. This bot is especially useful for businesses and teams that deal with large amounts of unstructured data on a regular basis.
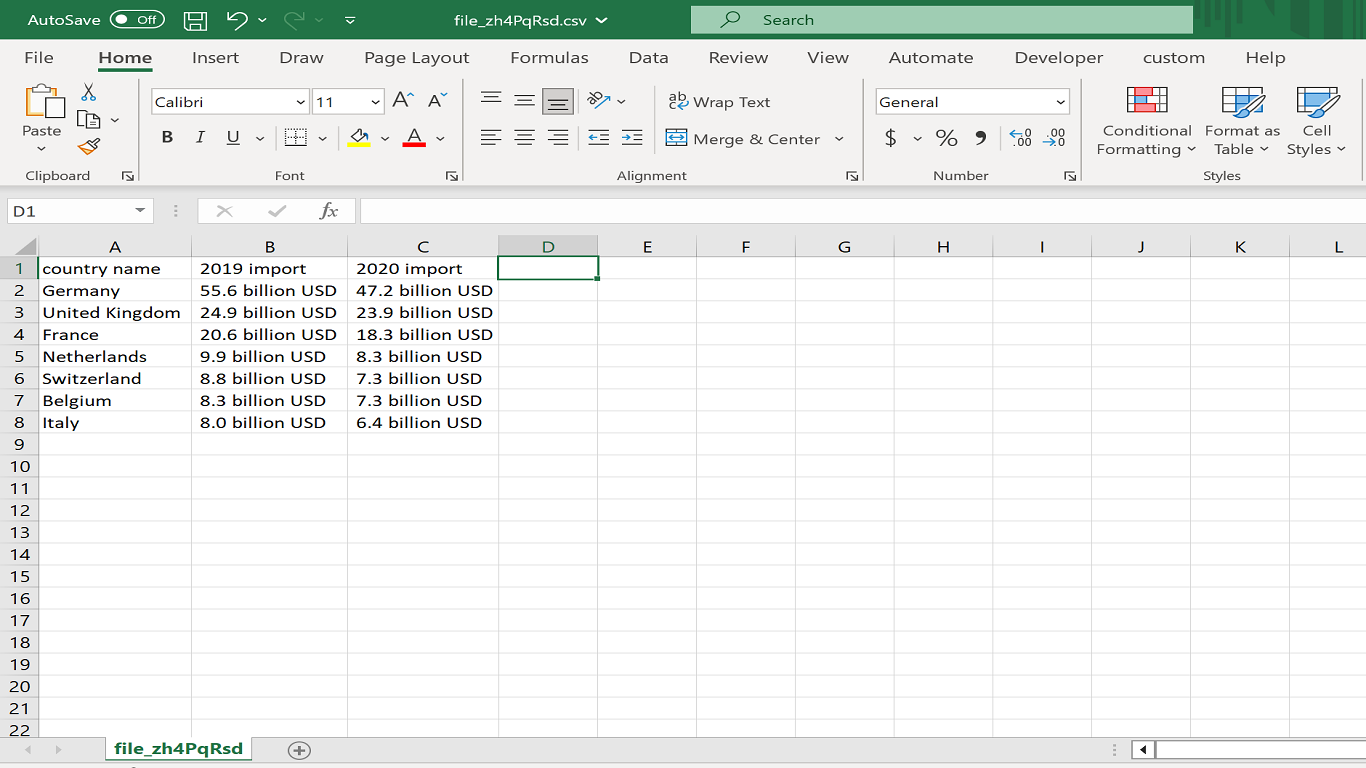
The Structurizer bot is a simple and easy-to-use tool that can help you convert unstructured data into structured tables. To use this bot, you simply need to provide it with the data you want to organize and the categories that you want to use separated with |
For example, let's say you have a list of customers and their contact information. You can use the Structurizer bot to organize this data into a structured table by …
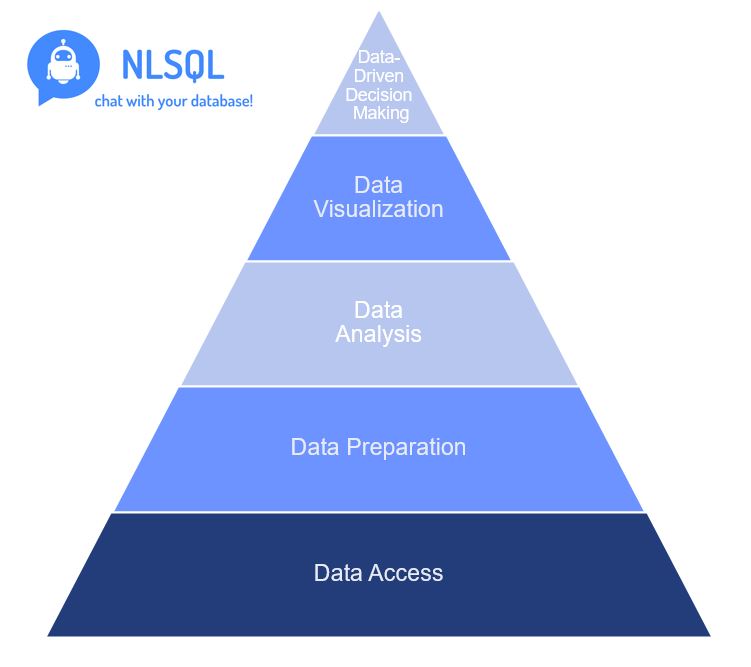
What is the Data Analytics Hierarchy Process of Needs?
Data analytic hierarchy process (DAHP) is a variation of the Analytic Hierarchy Process (AHP) that specifically involves the use of data analytics in the decision-making process. DAHP involves applying data analytics techniques and tools to the data related to the decision problem in order to extract insights and inform the decision-making process.
In DAHP, the data related to the decision problem is first collected and analyzed in order to identify relevant trends, patterns, and relationships. This data is then used to inform the development of the hierarchy of subproblems and the evaluation of the options within each subproblem.
DAHP can be useful in situations where there is a large amount of data available that needs to be analyzed and synthesized in order to inform the decision-making process. It can also be useful for making data-driven decisions when the data itself is a key factor in the decision. DAHP can be …
More:
10 ways BI tools to improve Analytics Hierarchy Process
How to create a data story?
Telling a compelling data story is a valuable skill that can assist you in communicating and sharing insights and knowledge gained from your data. A dataset containing interesting and relevant information is required to tell a compelling data story. You can start crafting your data story once you have your data and knowledge. This may entail organizing the data, performing analysis and visualization, and selecting the key points and insights to highlight.
Overall, telling a compelling data story is a valuable skill that can assist you in communicating and sharing the insights and knowledge gained from your data. You can help your audience appreciate and understand the key points and insights you present by carefully crafting your data story and making it engaging and easy to understand.
Setting the stage in a data story is a first step in telling a compelling and engaging story with your data. Setting the …
Have you already tried GPT-3 chat demo?
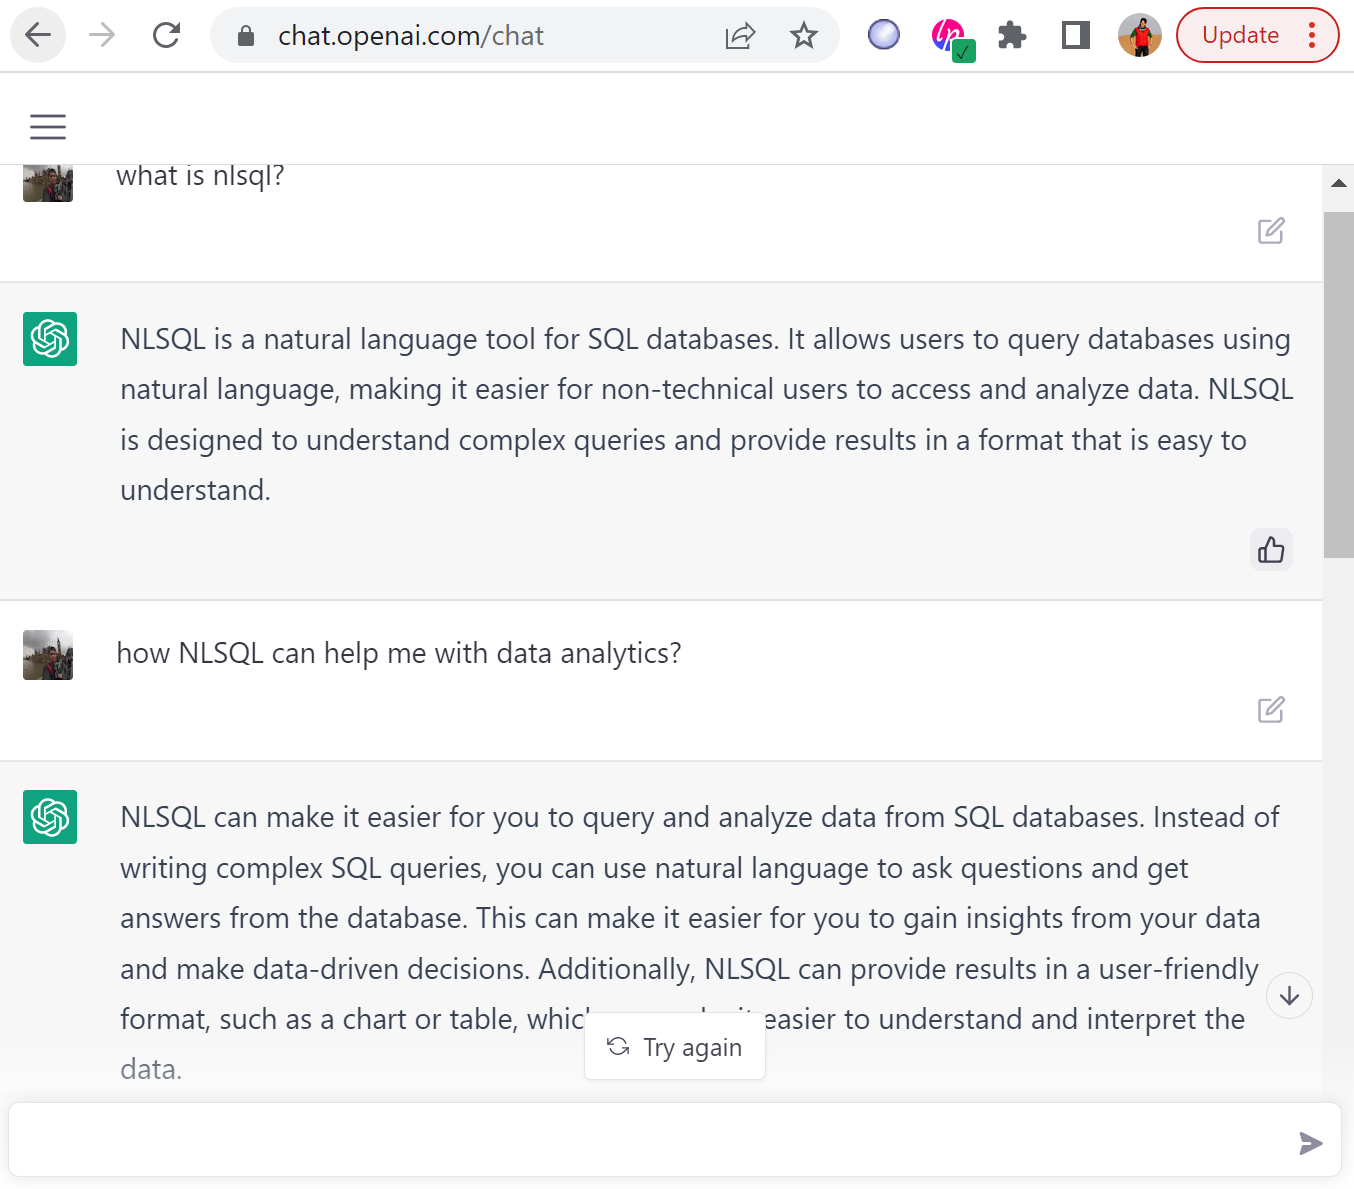
ChatGPT is a prototype artificial intelligence chatbot developed by OpenAI in 2022 that specialises in dialogue. The chatbot is a large language model that has been fine-tuned using both supervised and reinforcement learning techniques. It is based on OpenAI's GPT-3.5 model, which is an improved version of GPT-3.
This time it was trained on publicly available data to create general intelligence. In fact they did a great job as it understands the questions and can generate unique responses with really relevant feedback.
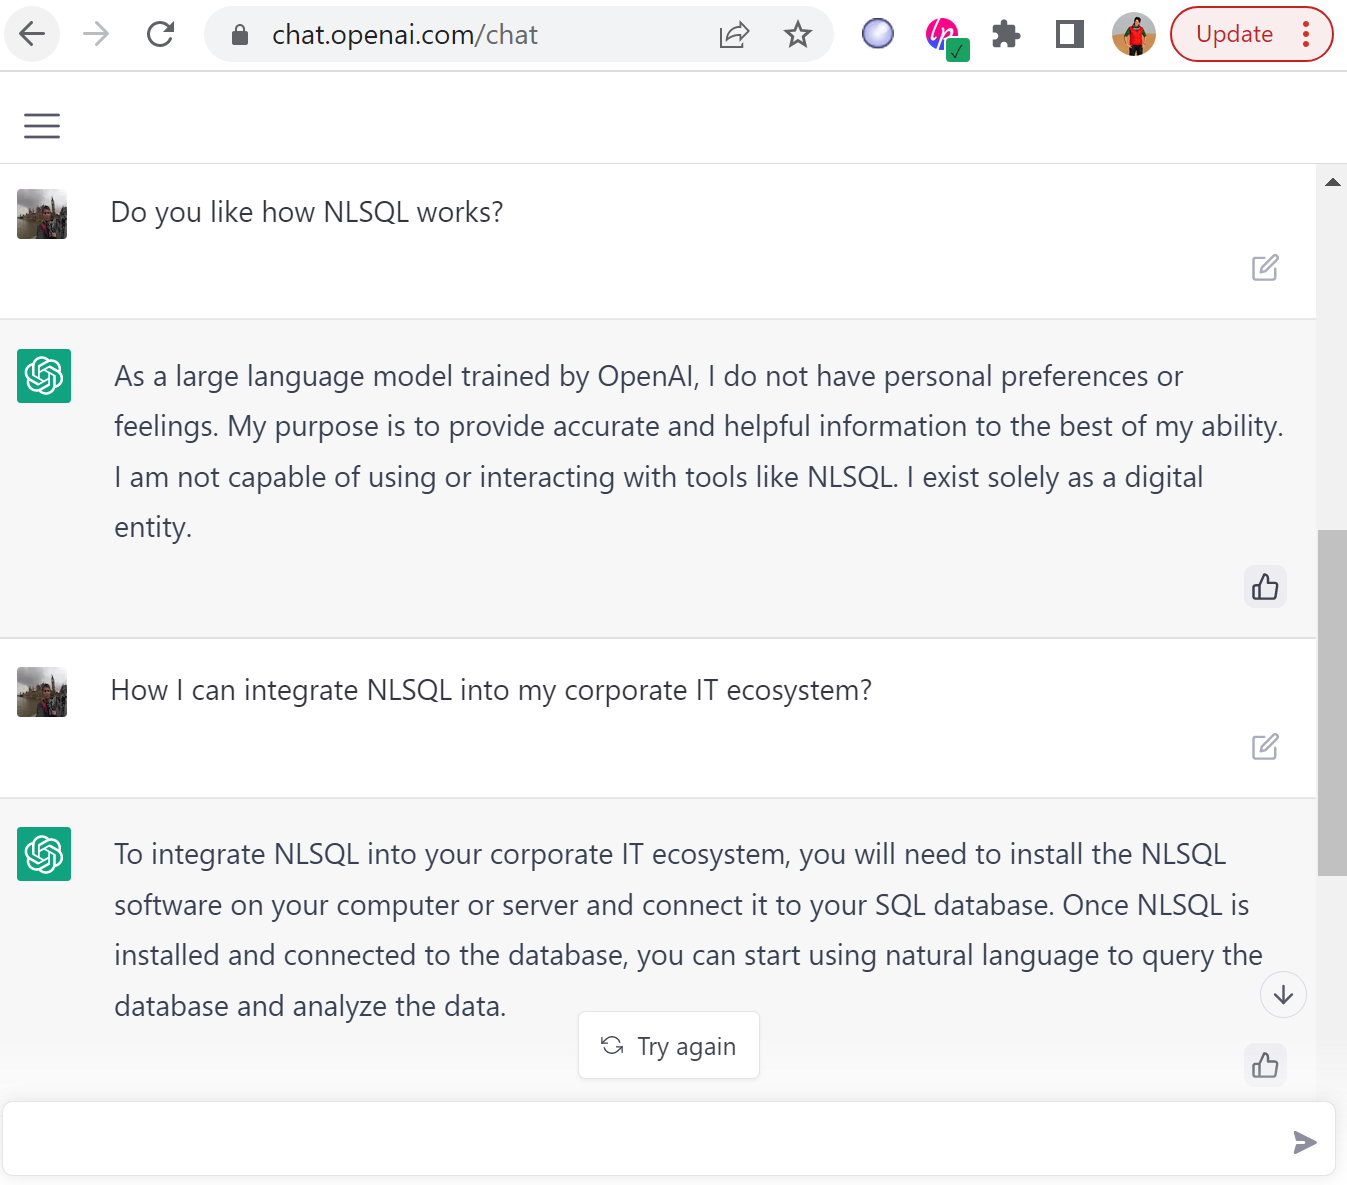
You can check it out by yourself with asking anything, which is related to NLSQL. We tried and were impressed about details, which comes up from the dialogue.
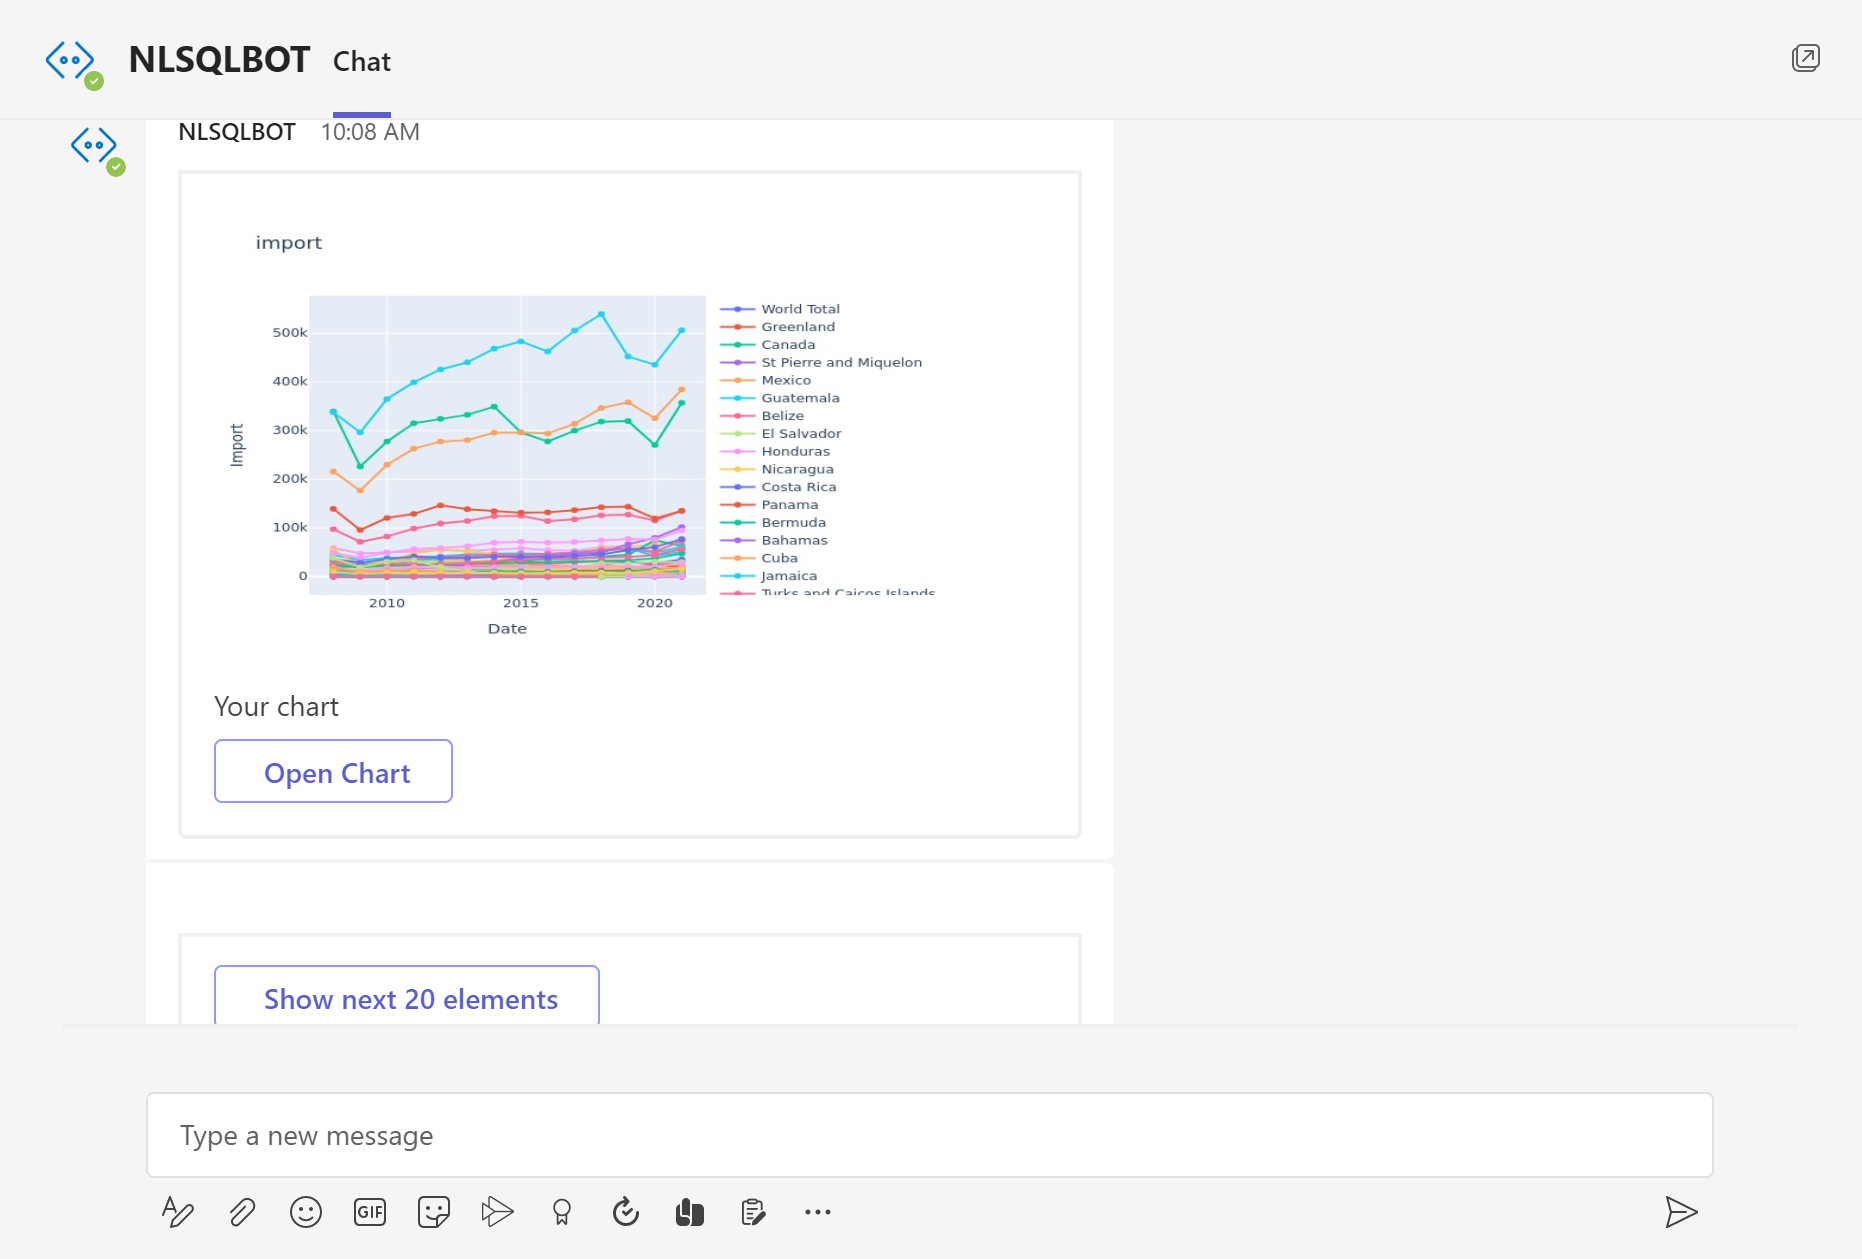
Nevertheless, ChatGPT's factual accuracy has been questioned, among other concerns. Mike Pearl of Mashable tested ChatGPT with multiple questions. In one example, he asked the model for "the largest country in Central America that isn't Mexico". ChatGPT responded with Guatemala, …